An interactive SDOH map that strengthens community health partnerships
Custom SDOH interactive map, enhanced user experience, and customized CRM platform helps Duke strengthen its community partnerships.
Where research meets community impact
As a private research university and healthcare provider, Duke is also a corporate partner and neighbor, which guides its commitment to building partnerships that offer mutual benefit and the greatest positive impact to communities.
Duke needed a custom research application that could display the intersection of its community initiatives with social determinants of health (SDOH) datasets using a mapping overlay technique, bringing together scattered data into a single, powerful population health management platform for students, researchers, faculty, and community members.

Client
Duke Health
Industries
Digital Health, Social Drivers of Health, Education
Engagement
Alignment Workshop → Design → Custom Development
Services
Alignment workshop, Landscape analysis, Solution architecture, UX research & design, Data modeling / API architecture, Functional prototype, Custom software development
Platform
Web (React + Ruby on Rails)
Siloed data prevented Duke from measuring community impact
Duke needed an integrated platform that could serve as a central hub for the university's partner programs. Duke's partner data was siloed in different locations and formats across the institution, which prevented Duke University and Duke Health from being able to harness that data to deliver value to Duke's stakeholders.
The ideal solution would collect, centralize, and store partner data, while also providing users with functionality in:
Mapping
Interactive dashboard enables users to explore initiatives and social drivers of health data.
Matching
Matching functionality brings together organizations and individuals through events, groups, causes, volunteer opportunities, & fundraisers.
Grant management
Grant management portal helps grant managers and grant seekers manage & apply for grants.
Back-end management and analytics
Up-to-date source of truth enables users to analyze and learn about the Duke Partnership Community.
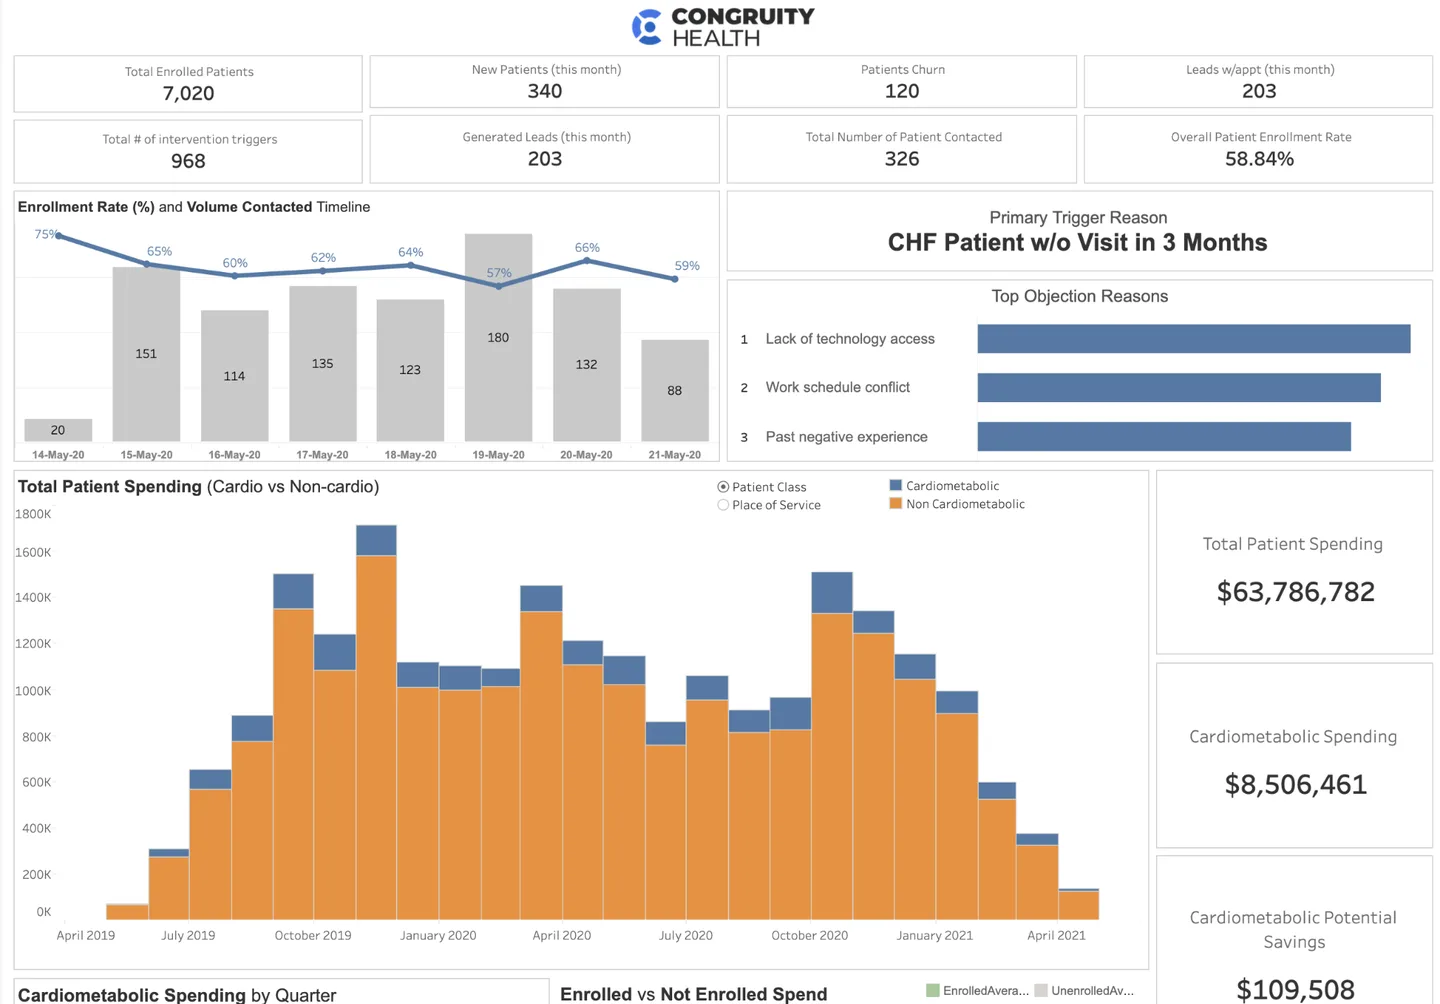
SDOH and community outcomes
The World Health Organization has determined that social factors regularly contribute more to patient outcomes than that of any healthcare provided. Not surprisingly, integration and utilization of SDOH data, combined with predictive analytics for healthcare, has become a priority in healthcare information systems.
A structured process for a complex platform
We knew going into the project the complexity of the users and features of the platform, so we worked to align with Duke every step of the way through a built-in process.
Building a platform that combines layers of disparate data is a highly complex process and requires a sound understanding of user needs and the necessary functionality. To provide more clarity around our approach, we walked our clients through each step of our process.

Alignment Workshop
Brings stakeholders together to align on product vision, user profiles, and priorities for building the product ecosystem.
Competitive Analysis
Our product team reviewed Duke's existing research. We then expanded the analysis to competitive and partnership markets.
Build, Buy, or Partner
Through a landscape analysis of mapping and data visualization tools, we compiled a Good, Better, Best model to finalize direction on an MVP, and made a buy-vs-build recommendation based on budget, features, and user needs.
Solution Architecture
From our research analysis, we developed a comprehensive solution architecture document that served as our product roadmap to translate scope and product needs with Duke's internal technical team.
Wireframes, Design & Prototype
Because of the complexity of the platform, we applied an agile approach to design, beginning with wireframes. By applying digital design best practices and working through the user journey, we created prototypes for the end-product, including functionality, look and feel, user experience, and integrations.
A platform connecting Duke to its community
Business administration CRM
We carefully planned and implemented the complex data models in a way that allowed for a clean user interface on the front-end with simple administrative workflows on the back-end.
- Dashboard
- Tasks
- Management
- Analytics
- Administration
- Directory
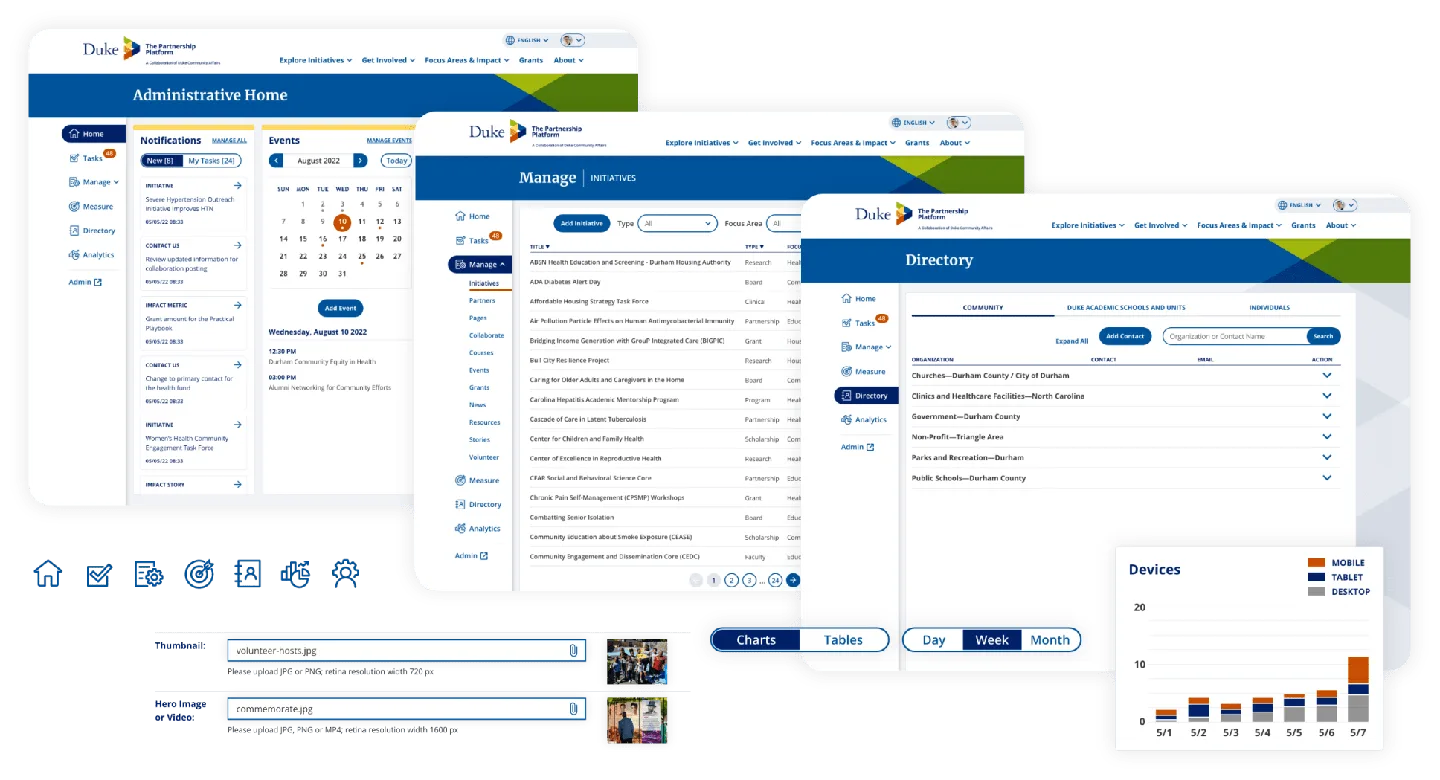
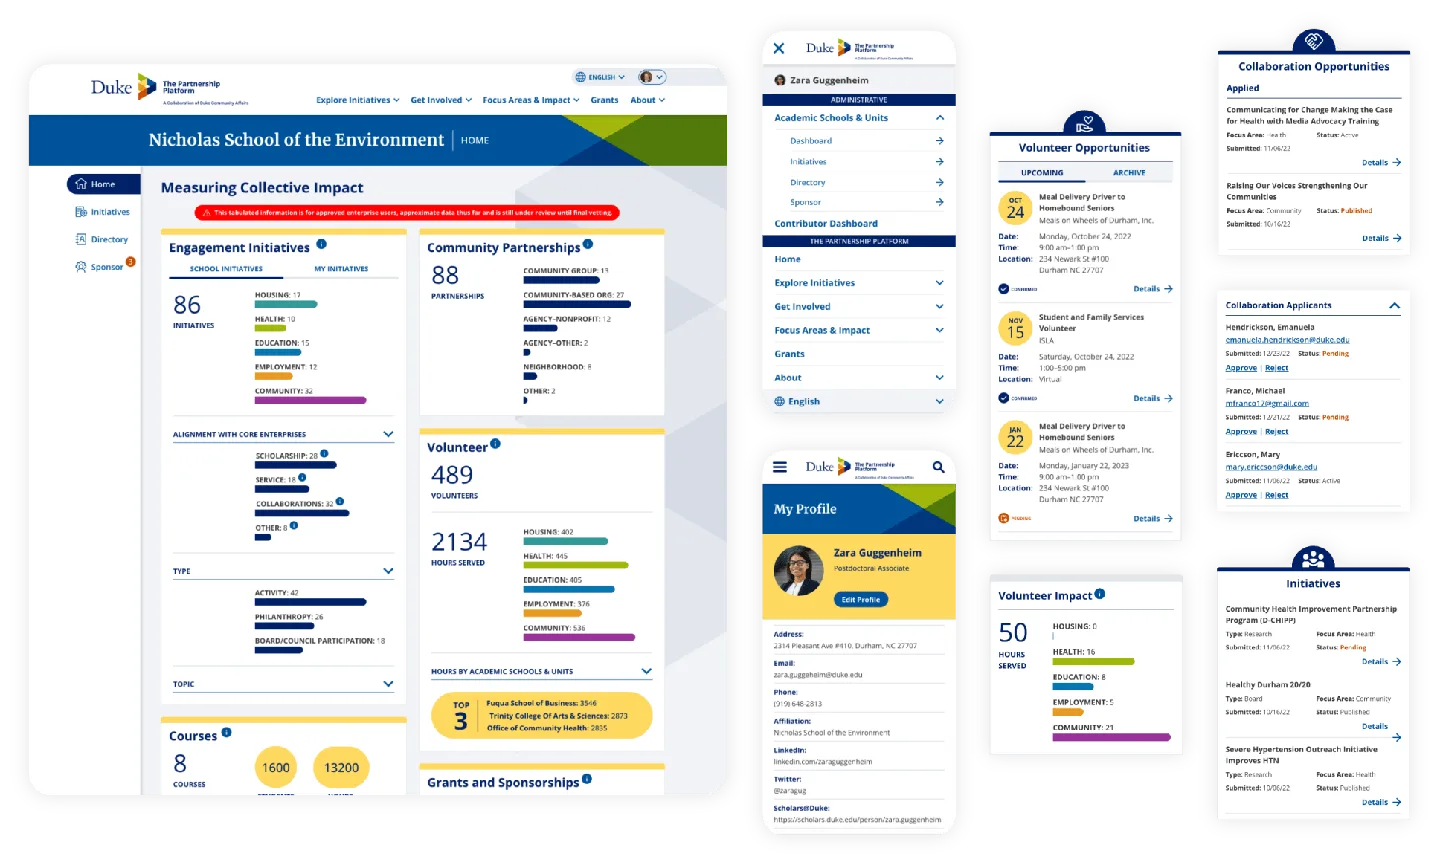
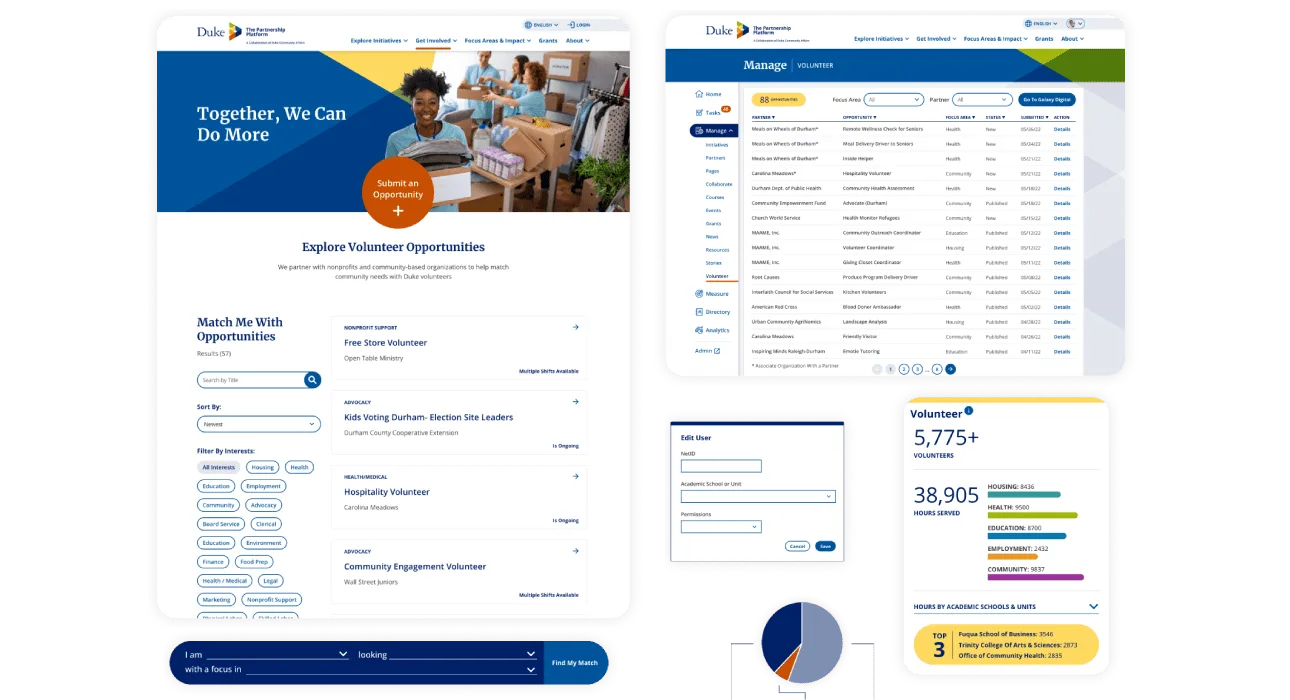
Customized, data-driven dashboards
Dashboards are unique to user types and individual profiles. Leadership can access data for Duke-sponsored initiatives, courses, volunteering, grants, and sponsorships. This complex data is presented in a simple and engaging format.
Individuals can seek insights into their community engagement according to their initiatives, volunteering, or collaboration interests.
- Customized dashboards and profiles
- Impact measurement
- Initiative insight and management
- Volunteer engagement and impact
- Collaboration management
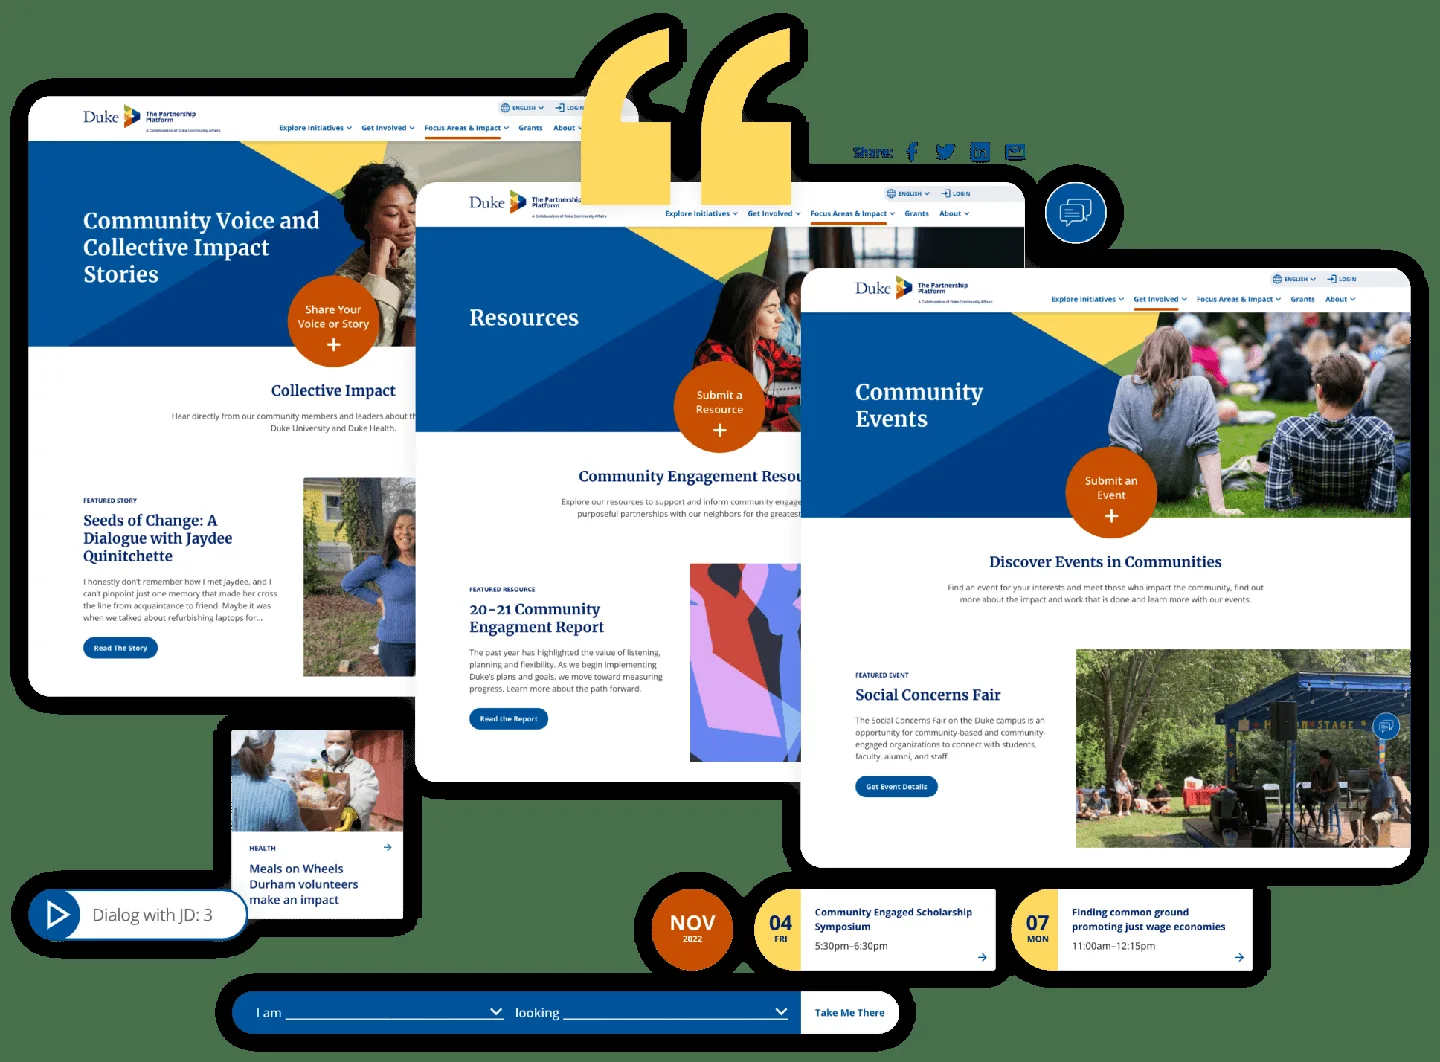
Engaging and intuitive front-end experience
We designed a unique and dynamic look for the platform, while maintaining the integrity of the Duke brand. The color and angles are inspired by the logomark, and tie in conceptually to the intersection of Duke and community collaboration.
As a new platform, we analyzed personas and the user experience to create the site architecture and an intuitive interface.
- Site architecture
- Interactive map - initiatives + SDOH layer
- Resource hub
- Volunteer and collaboration tools
- Grant and sponsorship tools
- Event calendar
- User content submission
- Training videos

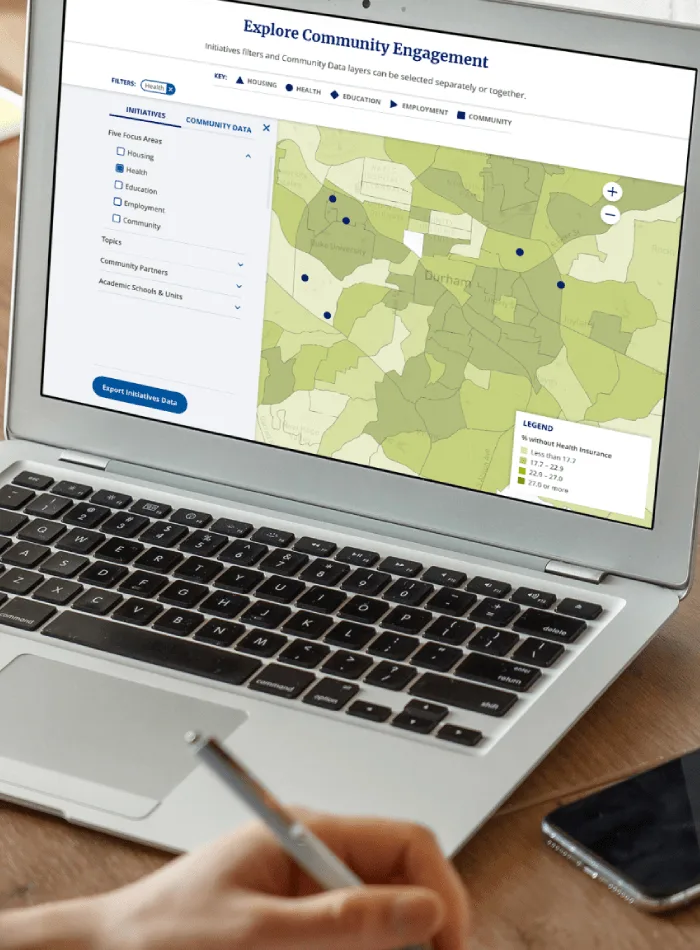
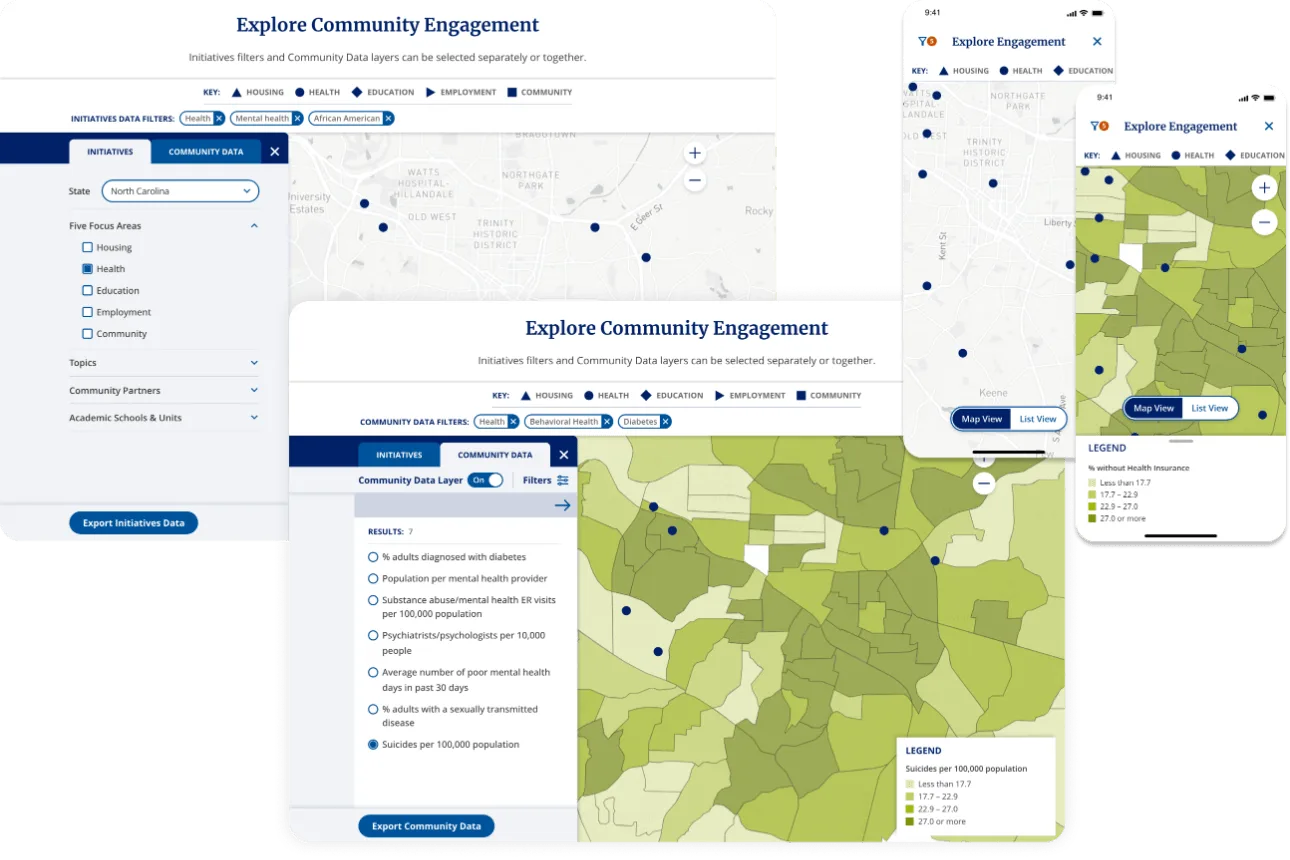
Interactive SDOH map
A powerful, interactive map that combines layers of SDOH data with Duke's community initiatives. This mapping tool enables users to search for initiatives and the intersection of those initiatives with nationally recognized SDOH data.
The mapping tool gives stakeholders greater visibility into Duke's collaborative efforts with its community partners and provides dataset layering so users can assess impact and need in specific geographic regions.
Enhancing the user experience with valuable integrations
We started with a competitive analysis to research the tools that would best meet user needs for volunteer activities and the grant application process.
These were seamlessly integrated into front- and back-end administrative tools and profiles.
- Volunteer management
- Shibboleth Single Sign-On
- Google Analytics
- Mapbox utilization
- Scholars@Duke API
Technology Stack
Stitching together hundreds of public datasets into one platform
One of the most ambitious aspects of this project was identifying, cataloging, and integrating public data from dozens of sources at the federal, state, and local level into a single, queryable research tool, a hallmark of our data analytics and engineering capability.
Local & national datasets integrated
Data sources cataloged
Focus areas mapped
National and local sources
Through our research, we identified over 400 local and national datasets spanning five focus areas. We drew from over 30 sources, ranging from national organizations to sources specific to North Carolina:
- U.S. Census Bureau
- Department of Housing and Urban Development (HUD)
- Bureau of Labor Statistics
- Durham Neighborhood Compass
- North Carolina's School Report Cards
- North Carolina Institute of Medicine
Key Data Sources
Duke's five focus areas
Duke's Partnership Platform focuses on five key areas, housing, health, education, employment, and community. All SDOH data is tagged and filterable through these five focus areas, enabling researchers and stakeholders to explore the intersection of community initiatives with social determinants of health.

Impacts of SDOH data on patient care
50%
of county-level variation in health outcomes attributed to SDOH
34%
spending reduction from preventing early chronic disease
5%
of patients account for 50% of all healthcare expenditures
The Partnership Platform
Digital Scientists partnered with Duke to launch a user experience that brings together integrations, workflow administration, and custom data mapping tools in a single ecosystem, the Partnership Platform. This platform serves varying persona needs and activities in a single experience that connects Duke to the community, and using various impact metrics, connects the community to Duke.
In collaboration with students, researchers, faculty, and community members, we created a platform rich with engaging data visualization, storytelling, opportunities, events, and initiatives for a range of user personas.
Key deliverables
- Powerful SDOH visualization tool for research and impact
- Map of all initiatives and community partners
- Overlay of initiatives and SDOH datasets
- Full integration with a volunteer management solution
- Functionality that links users to grant opportunities
- Library of resources, events, assets, videos, stories, and community data
- Light CRM and admin workflows
- Complex permissions across many different personas and use cases
Ready. Set. Innovate.
Let's talk about how Digital Scientists can help with your next project.