Strategic assessment and design sprint deliver an executive dashboard in days
Holbrook Life, a collection of high-end senior living communities, needed to align leadership on critical metrics and modernize their fragmented technology landscape. Digital Scientists delivered both through a strategic assessment and validated dashboard prototype.
7
Users Validated Prototype
5
Day Design Sprint
6
Systems Assessed
4
Validated UX Themes
Aligning leadership on what matters most
Holbrook Life is a collection of active adult living communities in the Southeast United States, specializing in high-end living experiences for Active Passionates, Enriched Living, and Inspired Living individuals. As a leader in senior living technology solutions, their vision is to inspire living life to the fullest and optimize well-being.
Digital Scientists partnered with Holbrook on a two-phase engagement. First, a comprehensive Strategic Assessment reviewed the company's business strategy, market forces, technology architecture, and customer experience from end to end. Then, a focused Design Sprint translated those findings into a tangible solution: an executive dashboard prototype that aggregated critical metrics from across the organization into a single, actionable view.
The result was C-suite alignment on shared goals, a validated prototype tested with 7 real users, and a clear technology roadmap, all delivered in days rather than months.
Client
Holbrook Life
Industry
Senior Living / Real Estate
Services
Strategic Assessment, Design Sprint, Prototyping, UX Research, Concept Validation
Engagement
2019
Method
Siloed systems, data overload, and no single source of truth
Holbrook's leadership struggled with data overload from multiple disconnected platforms. Critical resident, financial, and operational information was scattered across Yardi CRM, Yardi Voyager, PointClickCare, ServingIntel, and Yardi Rent Cafe, with unclear data responsibilities between systems and no centralized source of truth.
Fragmented Resident Data
Resident information was distributed across Yardi CRM, Voyager, PointClickCare, and ServingIntel with no centralized profile. IDs had to be manually copied between systems.
Integration Difficulties
Yardi's "integration partner" service lacked documentation and clear APIs. Custom integrations between CRM and Voyager were inflexible and restricted in scope.
No Request-Resolution System
No technology facilitated interactions between residents and employees for spa appointments, dining preferences, events, or maintenance requests.
Disjointed Onboarding
Resident data was created ad hoc across different systems during onboarding. The "Future Resident" to active resident transition was unclear between CRM and Voyager.
Obsolete Technology
ServingIntel required on-premise servers for every campus with no resident-facing account features. Current iPad app designs used nearly obsolete technologies listed in the SOW.
C-Suite Data Overload
Leadership lacked a unified view of operational metrics. Executives needed alignment on which data points mattered most for informed decision-making across communities.
Strategic Assessment: understanding the full picture
The Strategic Assessment reviewed Holbrook's strategic direction, customer journey, and technology readiness to generate a comprehensive vision and plan. The engagement covered four pillars: business analysis, market analysis, technical assessment, and customer experience research.
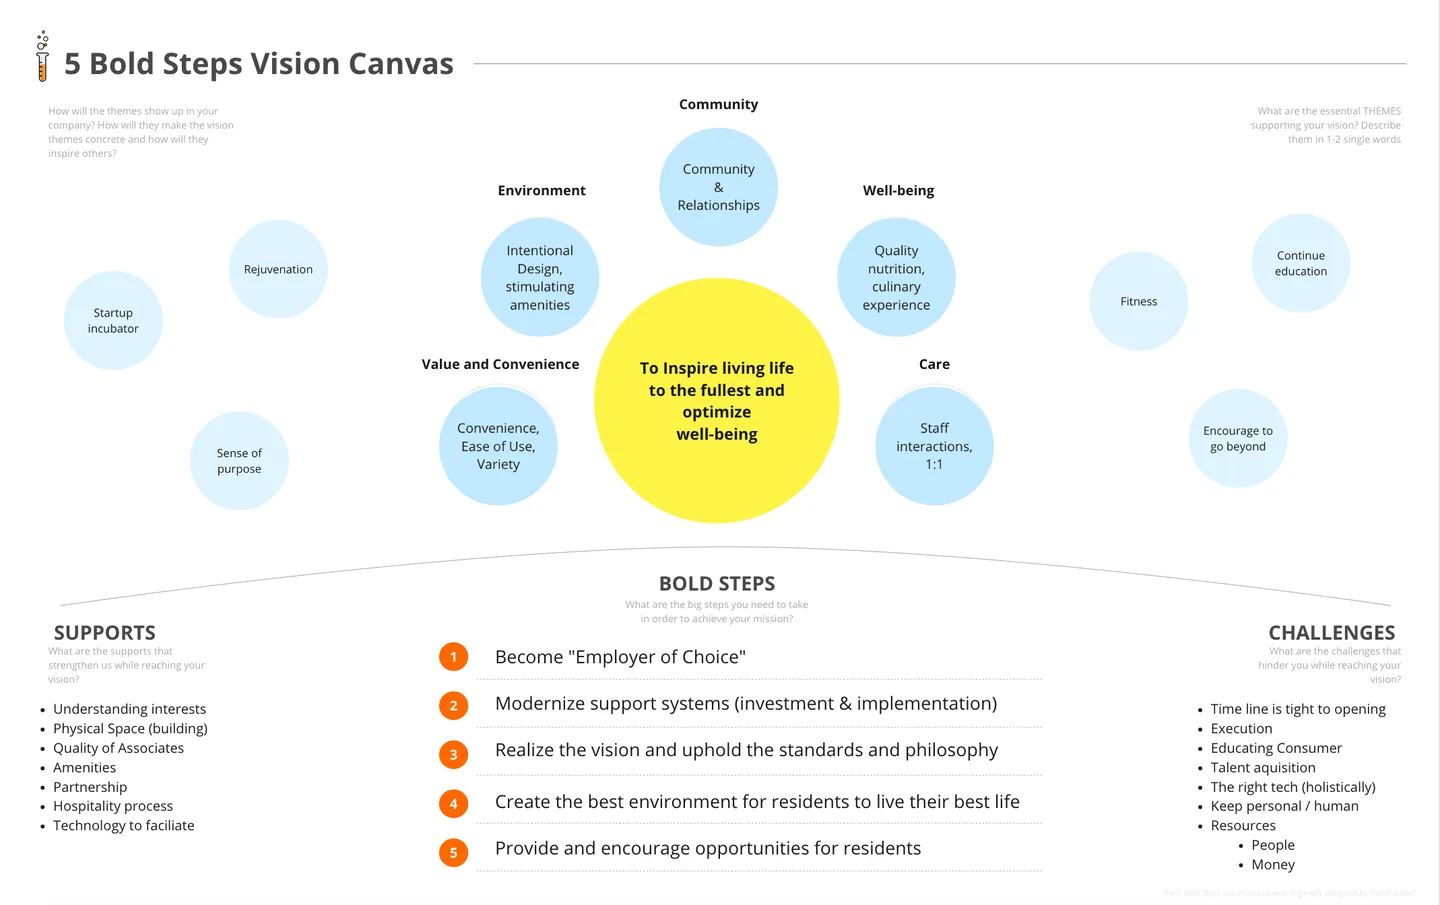
Business & Market Analysis
We examined how Holbrook's business works through a guided review of purpose, vision, and offerings. Using the 5 Bold Steps Vision Canvas, leadership identified key steps to achieve their vision: becoming an "Employer of Choice," modernizing support systems, and creating the best environment for residents.
Market analysis surfaced trends across technology, socioeconomics, culture, and market demands using Context Canvas and Trends Matrix tools. Key findings: smart home adoption among affluent seniors, demand for personalized experiences, and competition from Sunrise, Ritz-Carlton residences, and cruise ships.
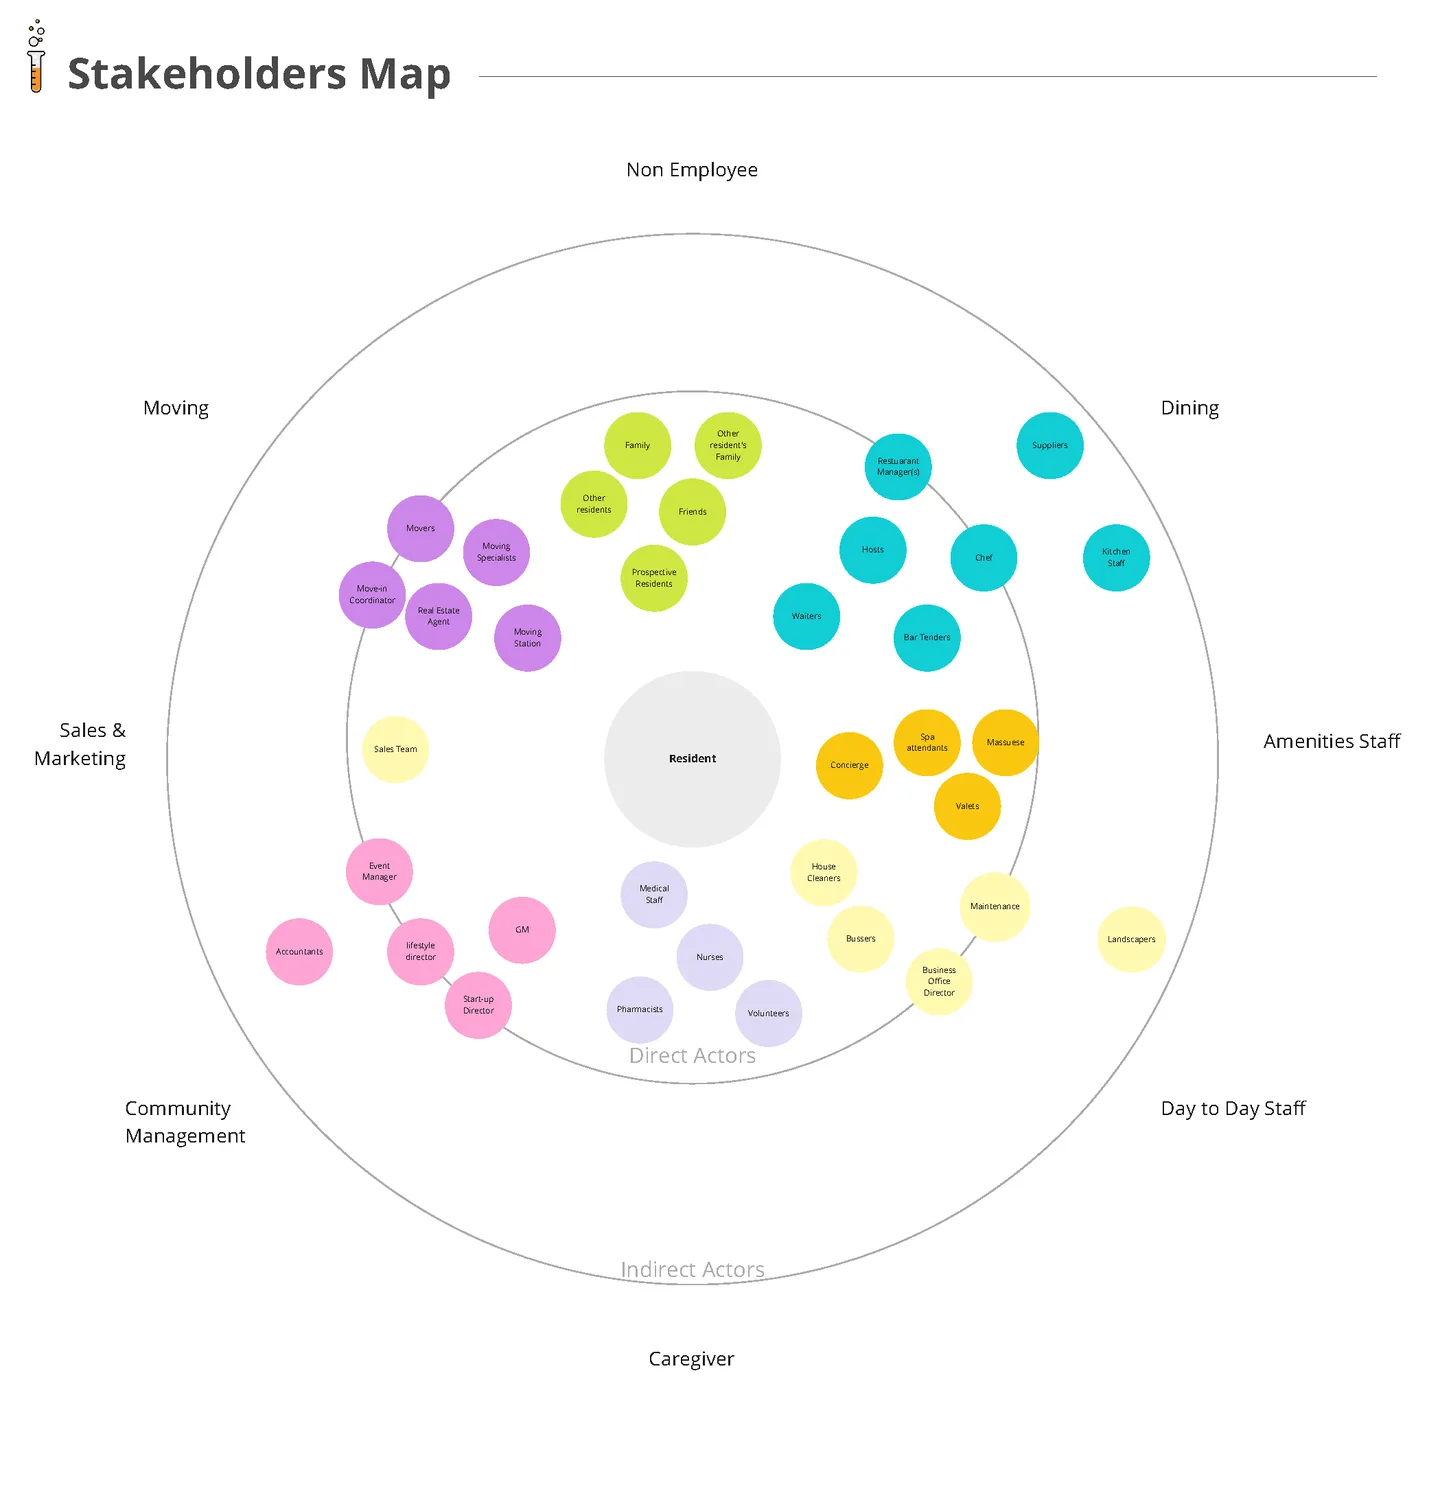
Stakeholder & Ecosystem Mapping
Stakeholder maps revealed the complexity of interactions within Holbrook communities. The analysis showed more stakeholders directly interacting with residents than operating backstage, highlighting the critical importance of training all front-line staff to deliver consistent service.
Third-party partners (Moving Station, dining providers, spa services) also interact directly with residents. Standards for these service providers must match the Holbrook experience across all touchpoints, from initial discovery through daily community life.
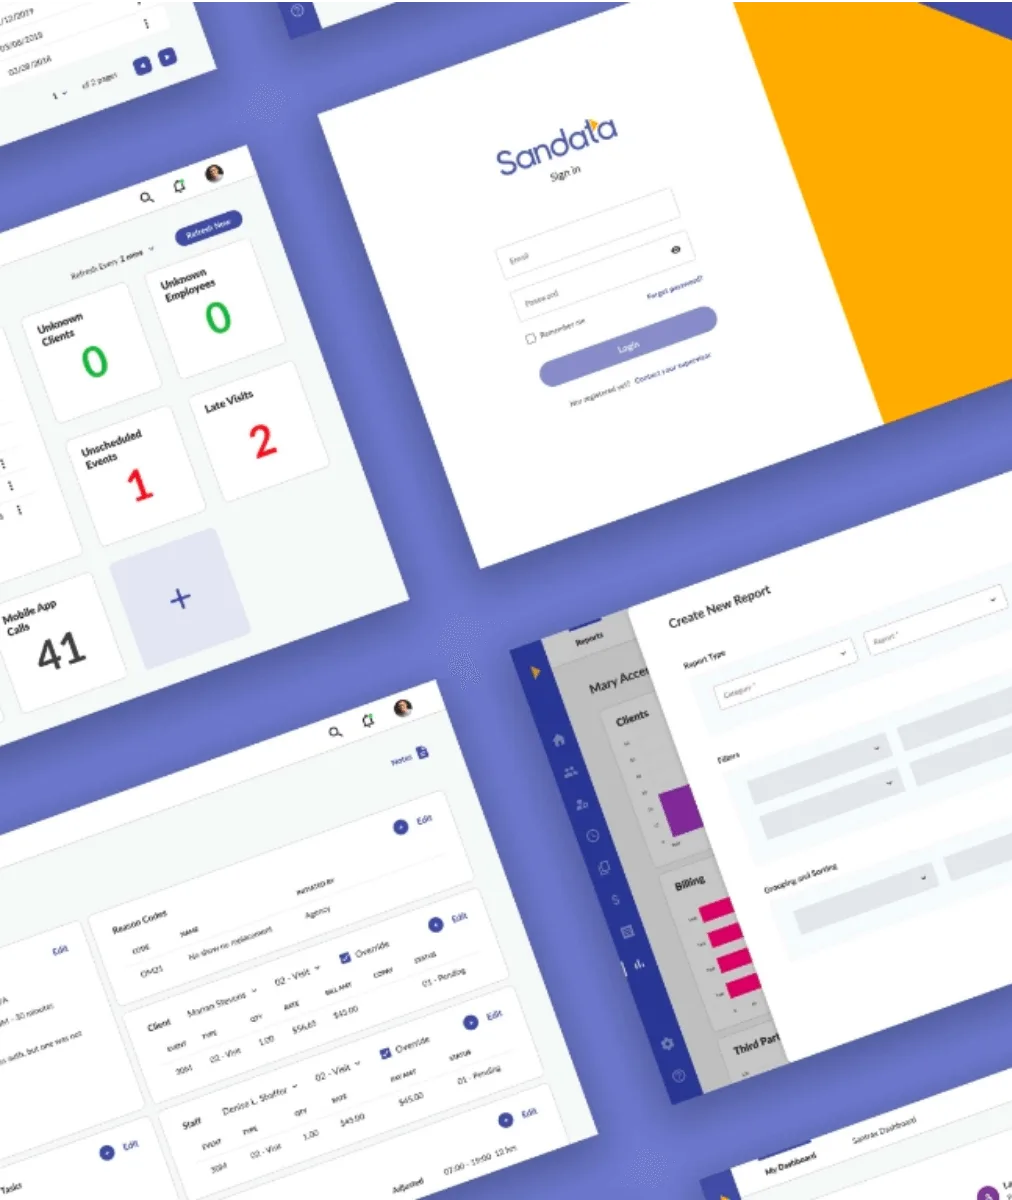
Six siloed systems with no interoperability
The technical assessment examined Holbrook's existing solution architecture, pain points, and gaps. The current infrastructure diagram revealed a critical lack of cohesion: Yardi, PointClickCare, and ServingIntel operated in complete silos with no data interoperability.
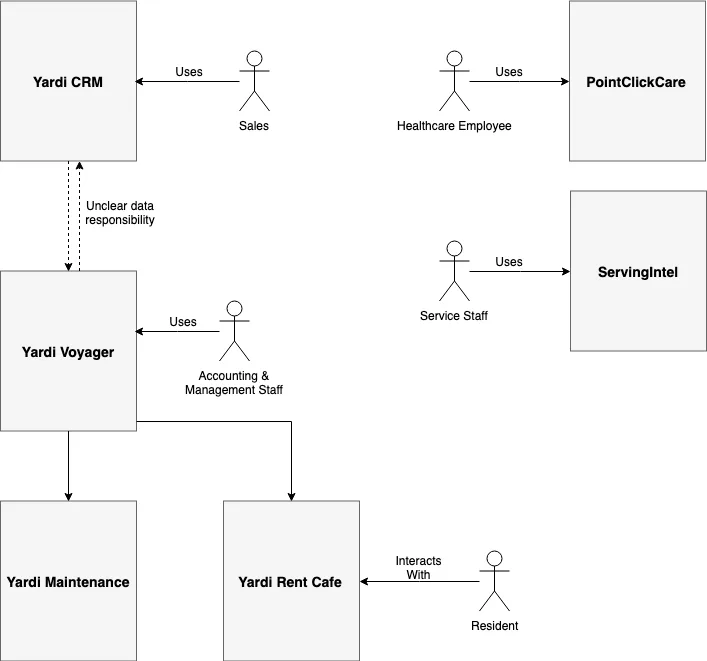
Current state: siloed systems with unclear data responsibility
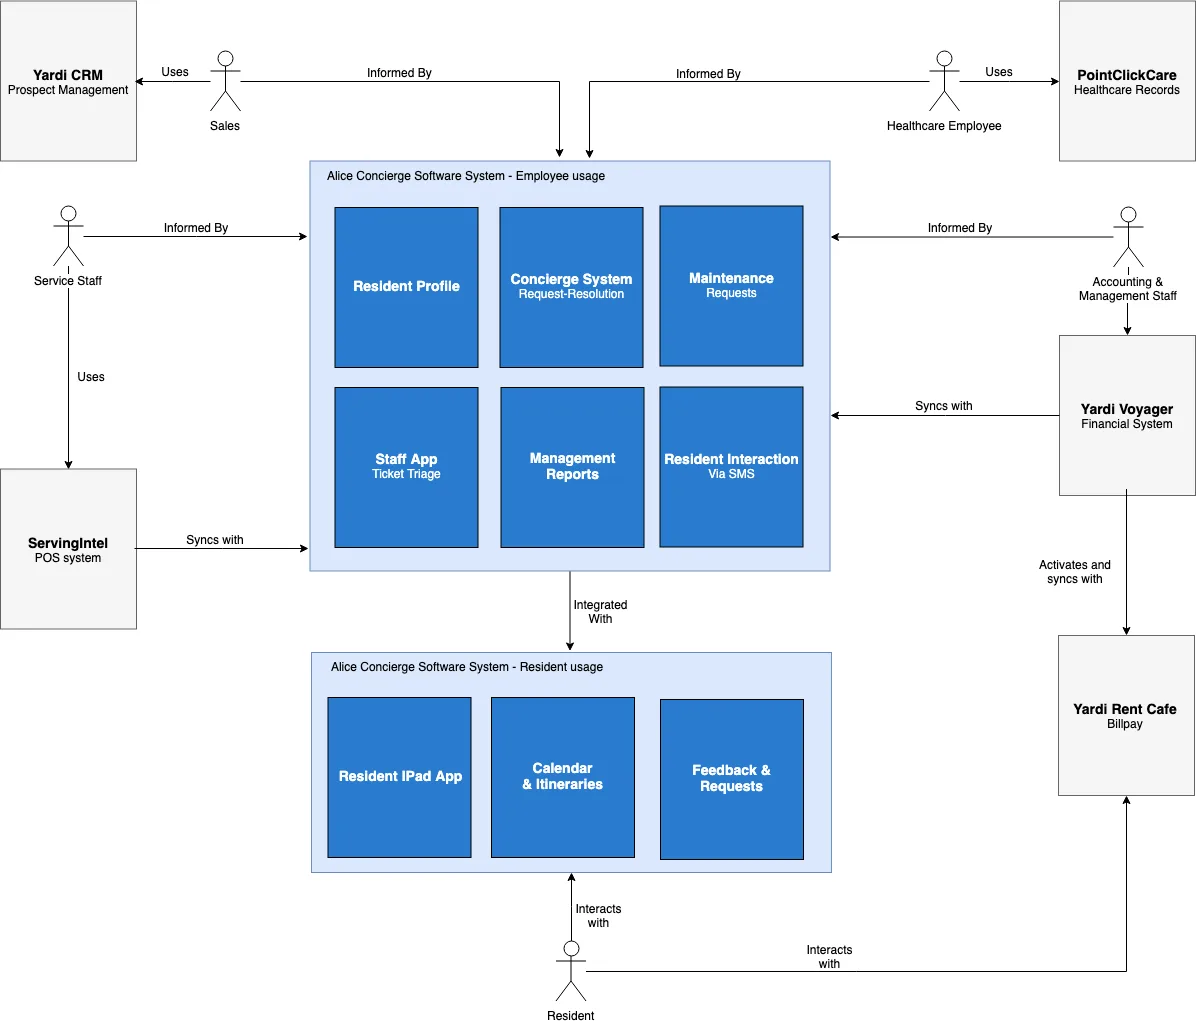
Recommended: centralized Alice Concierge platform
Yardi CRM
Lacked centralized resident info, inflexible preferences page, unclear transition from "Future Resident" to resident.
Yardi Voyager
No clear API, integration poorly defined. Data syncing was inflexible with undefined handoff from CRM.
PointClickCare
No cross-community reporting. Required manual association of Yardi customer numbers during resident creation.
ServingIntel
On-premise servers needed per campus. No resident-facing mechanism and undefined integration possibilities.
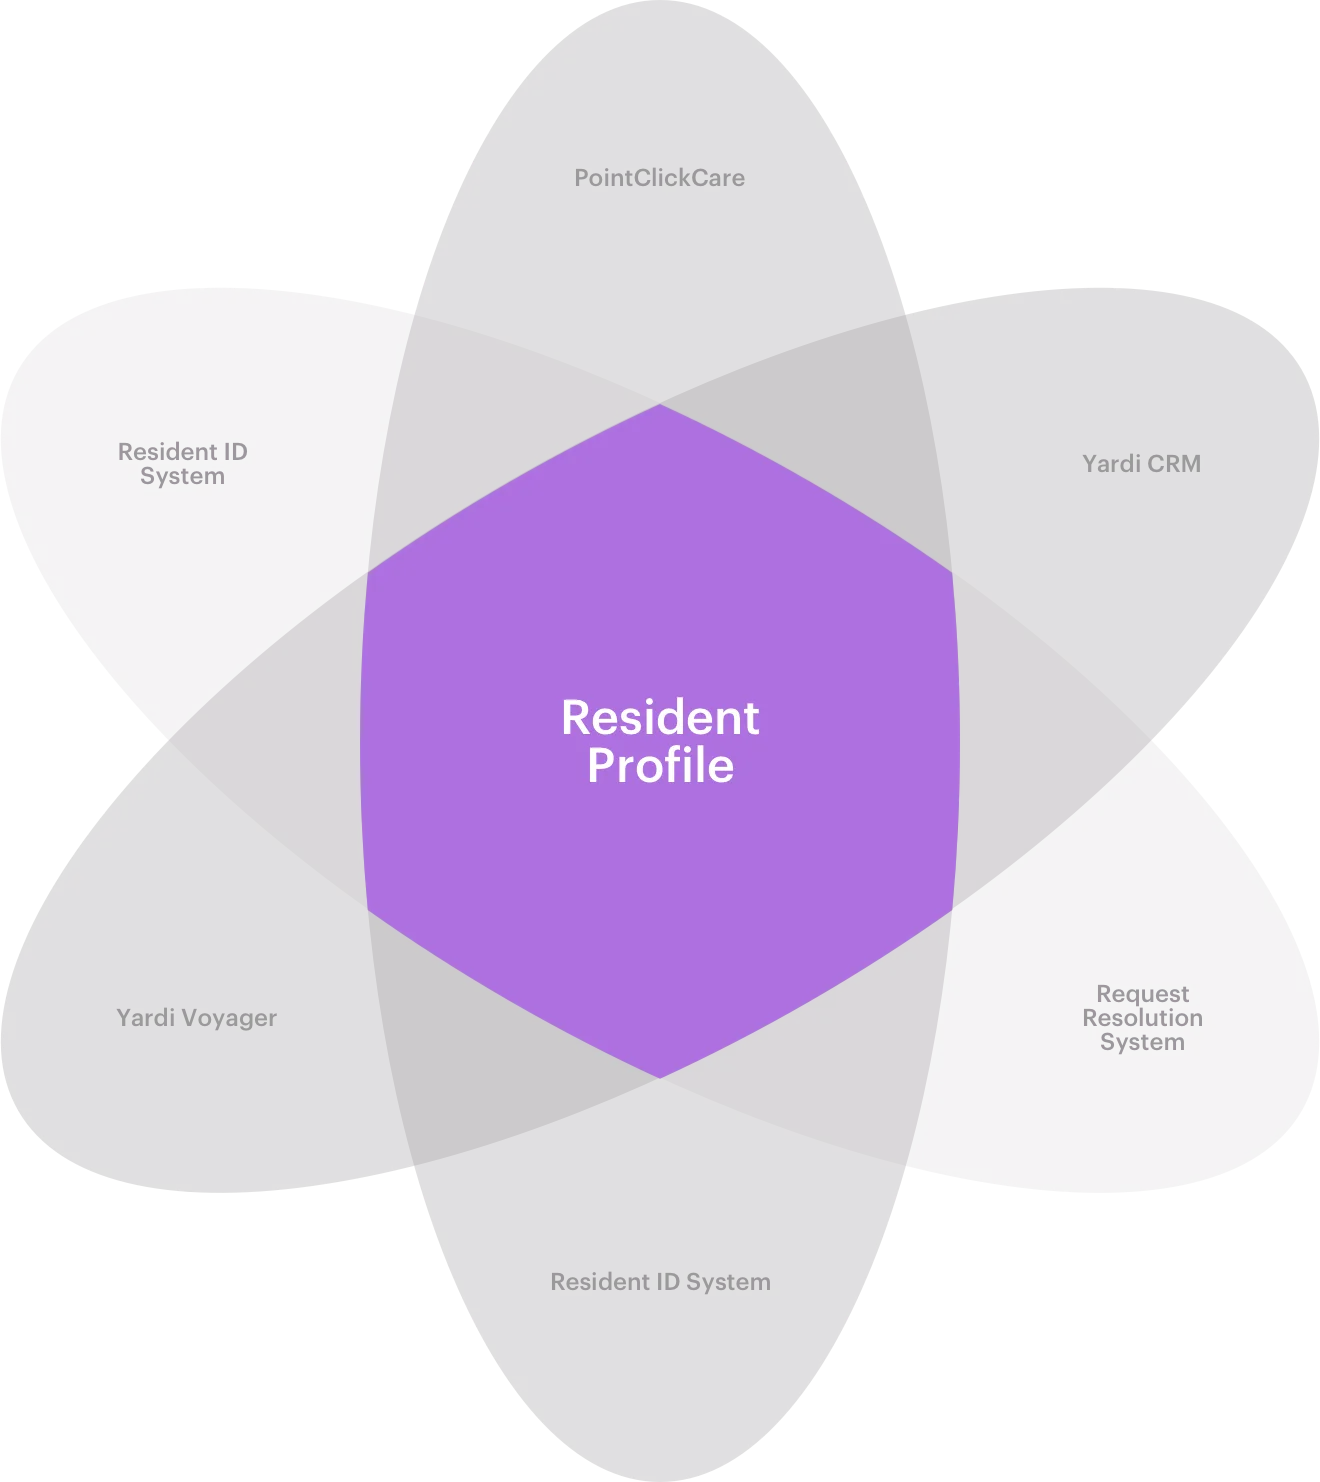
Gap: Resident Profile
Data distributed across systems with no centralized source of truth, leading to discrepancies and duplication.
Gap: Resident ID System
No standard identification method across service areas. Verbal self-ID insufficient for accessing preferences at scale.
Mapping the resident journey from discovery to daily life
Through stakeholder interviews, a secret site visit, and detailed research plans, Digital Scientists compiled a complete picture of the Active Passionate's journey, from initial awareness of Holbrook through purchase, customization, preparation, move-in, and daily community life.
Research Activities
The team conducted interviews with sales counselors, move-in coordinators, customization coordinators, the general manager, Moving Station partners, the head chef, consultants, the start-up director, and a depositor. An undercover site visit provided unbiased first-impression data.
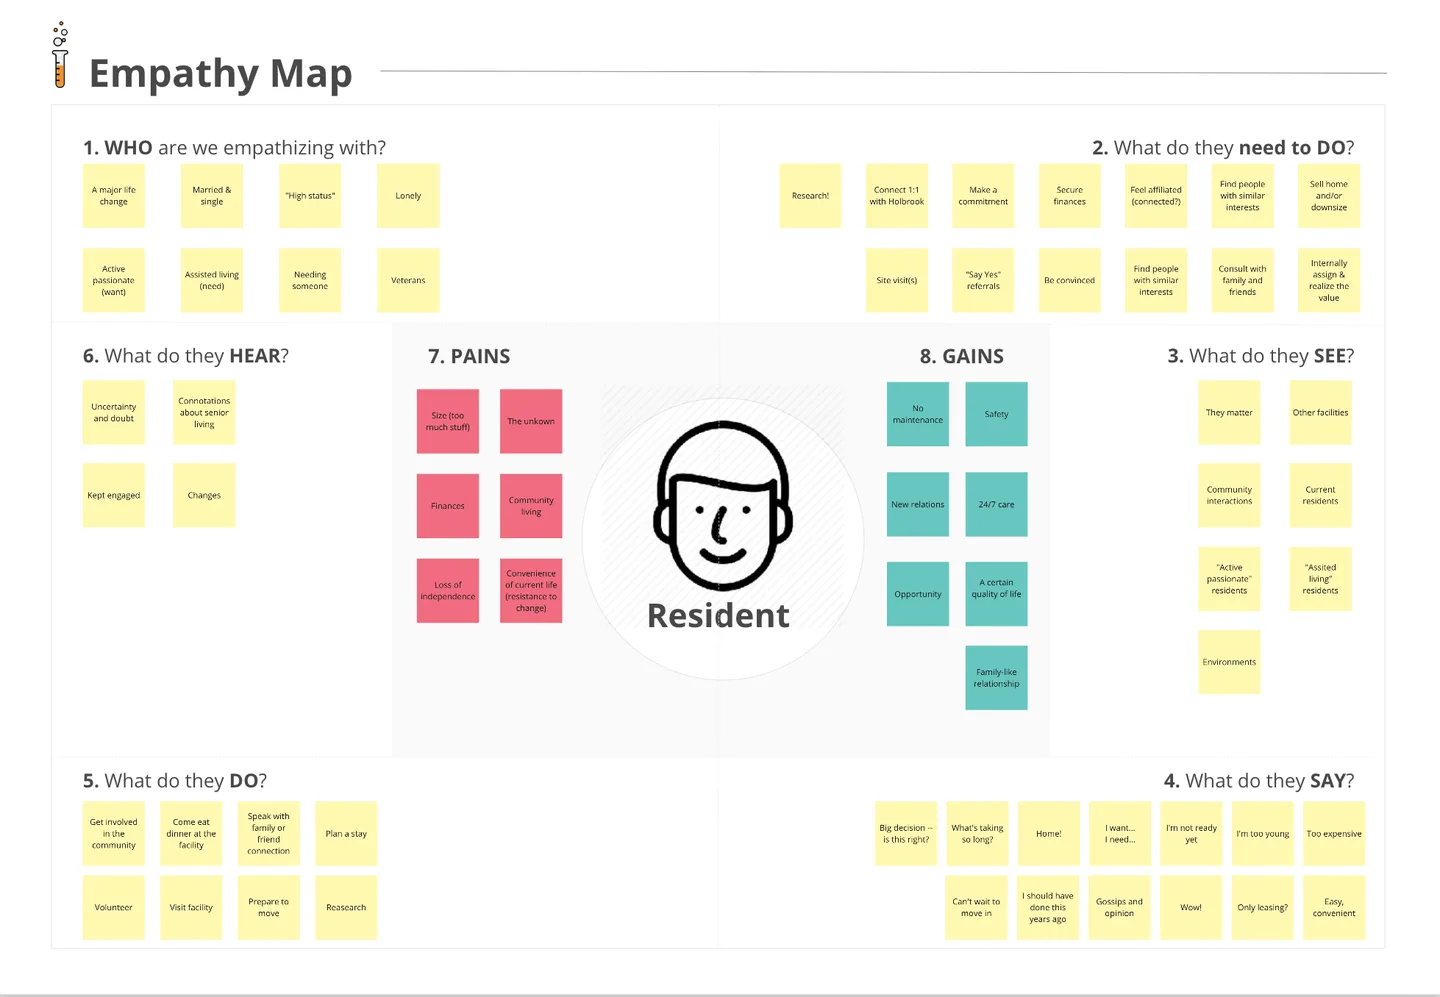
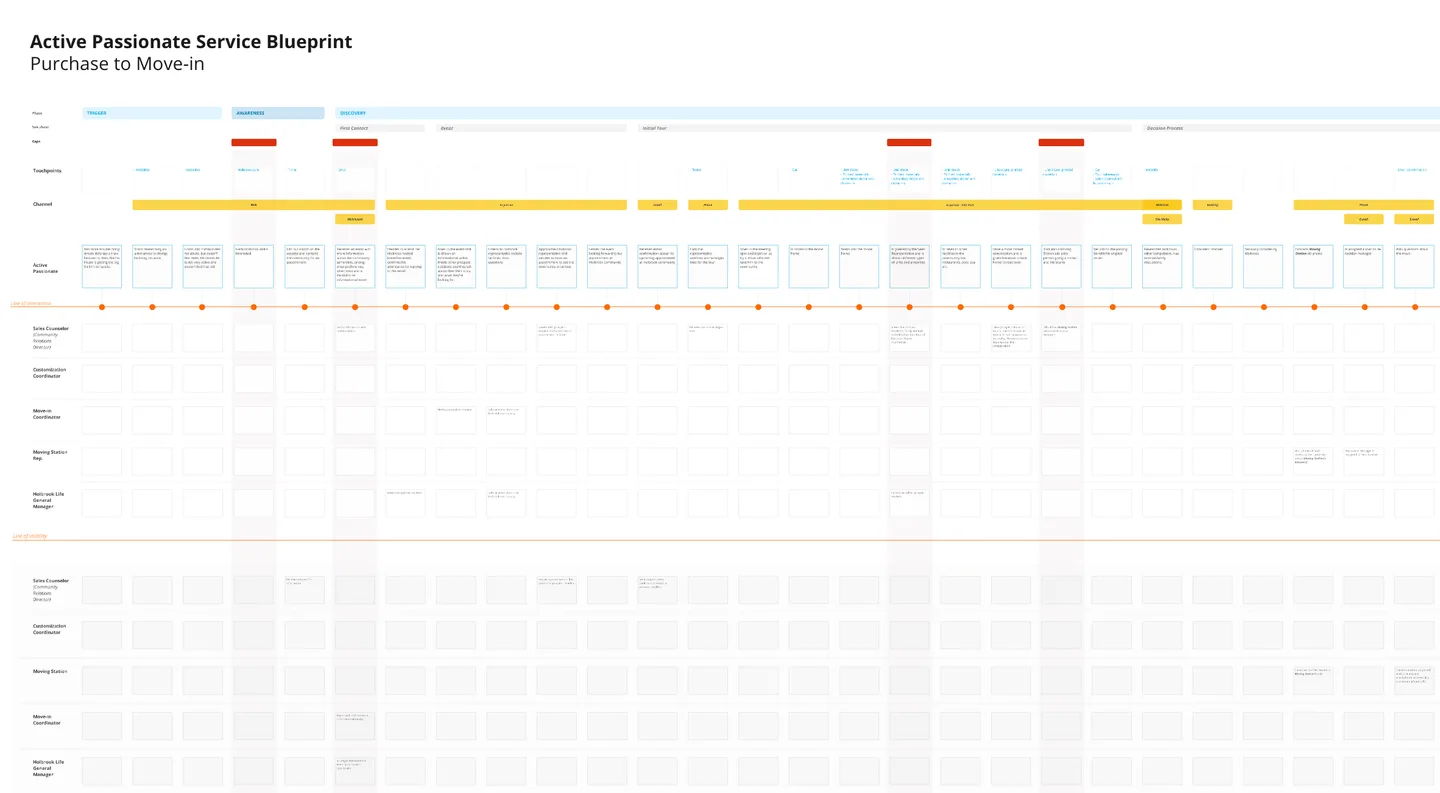
Empathy maps profiled residents' needs, pains, gains, behaviors, and environment. Service blueprints mapped both front-stage interactions and backstage operations, revealing gaps in marketing alignment, first impressions, partner leverage, and the customization process.
Key Service Blueprint Insights
- Marketing-reality gap: Dissonance between marketing materials and community reality risked depositor trust and resident satisfaction
- First impressions matter: The first touchpoint should embody exclusivity, expertise, and inspiration, the Holbrook brand
- Partner leverage: Moving Station's expertise in managing emotional journeys should be introduced earlier in the sales process
- Too many cooks: Once a prospect becomes a depositor, multiple stakeholders make contact with no centralized communication tool
- Celebrate milestones: Deposit, lease signing, unit readiness, and move-in are meaningful moments that deserve acknowledgment
Design Sprint: from alignment to validated prototype in 5 days
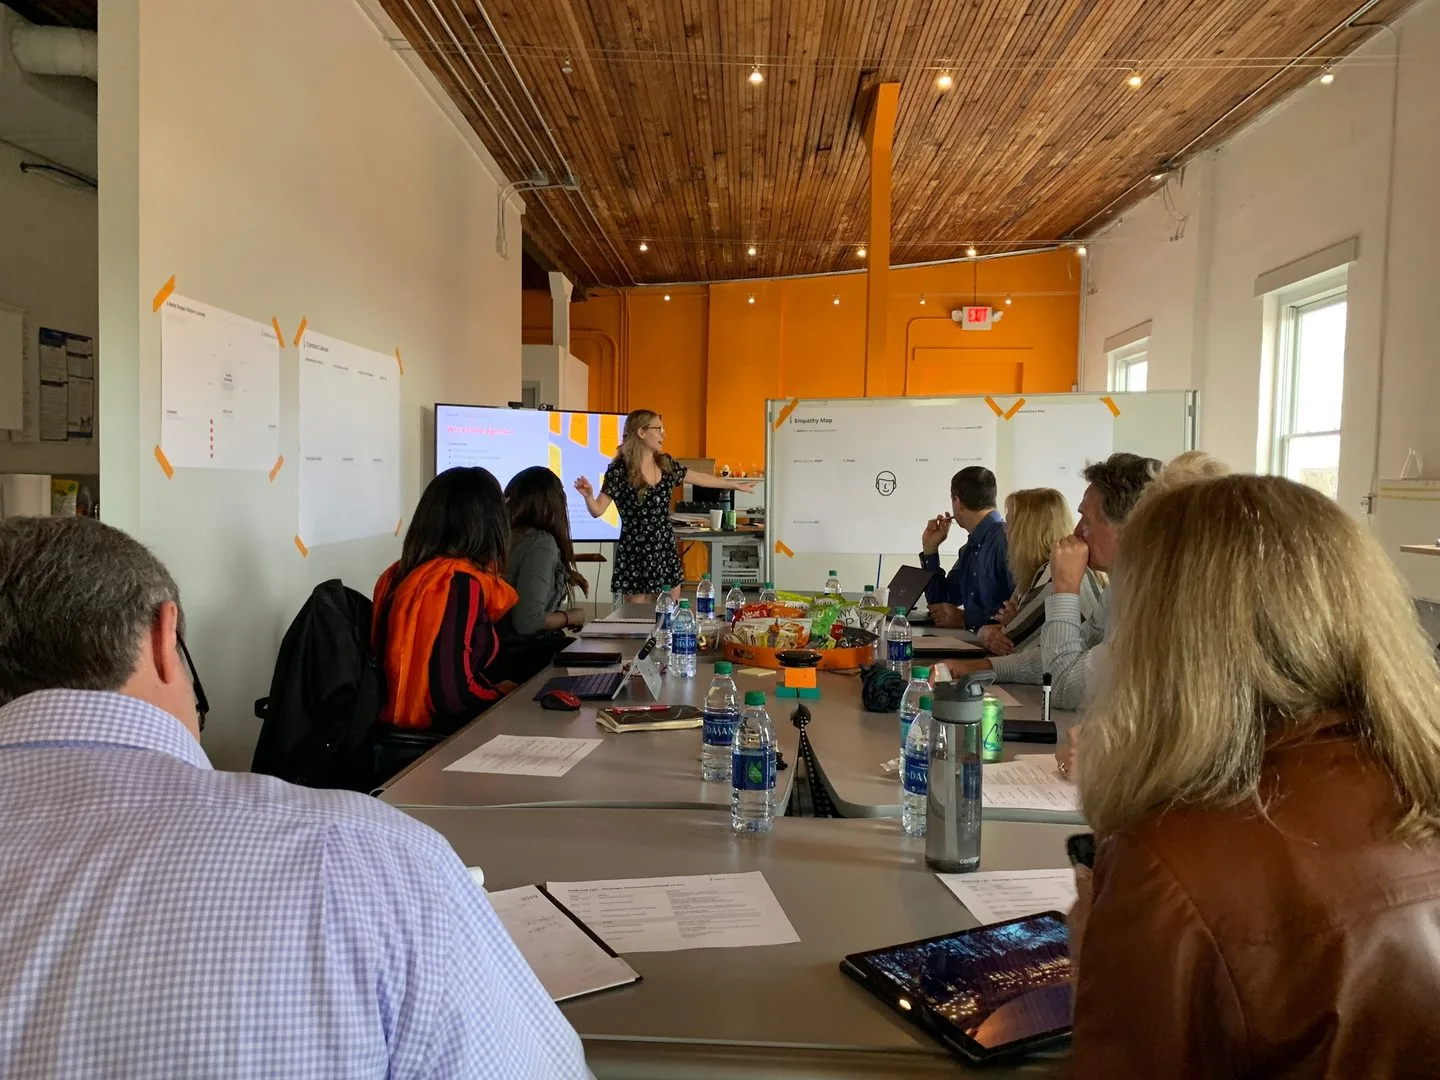
Building on the strategic assessment findings, Digital Scientists facilitated a design sprint with 11 Holbrook stakeholders. Through collaboration, rapid prototyping, and user testing, the team compressed months of alignment work into a single week, delivering a clickable dashboard prototype tested with 7 real end users.
Workshop & Prototyping
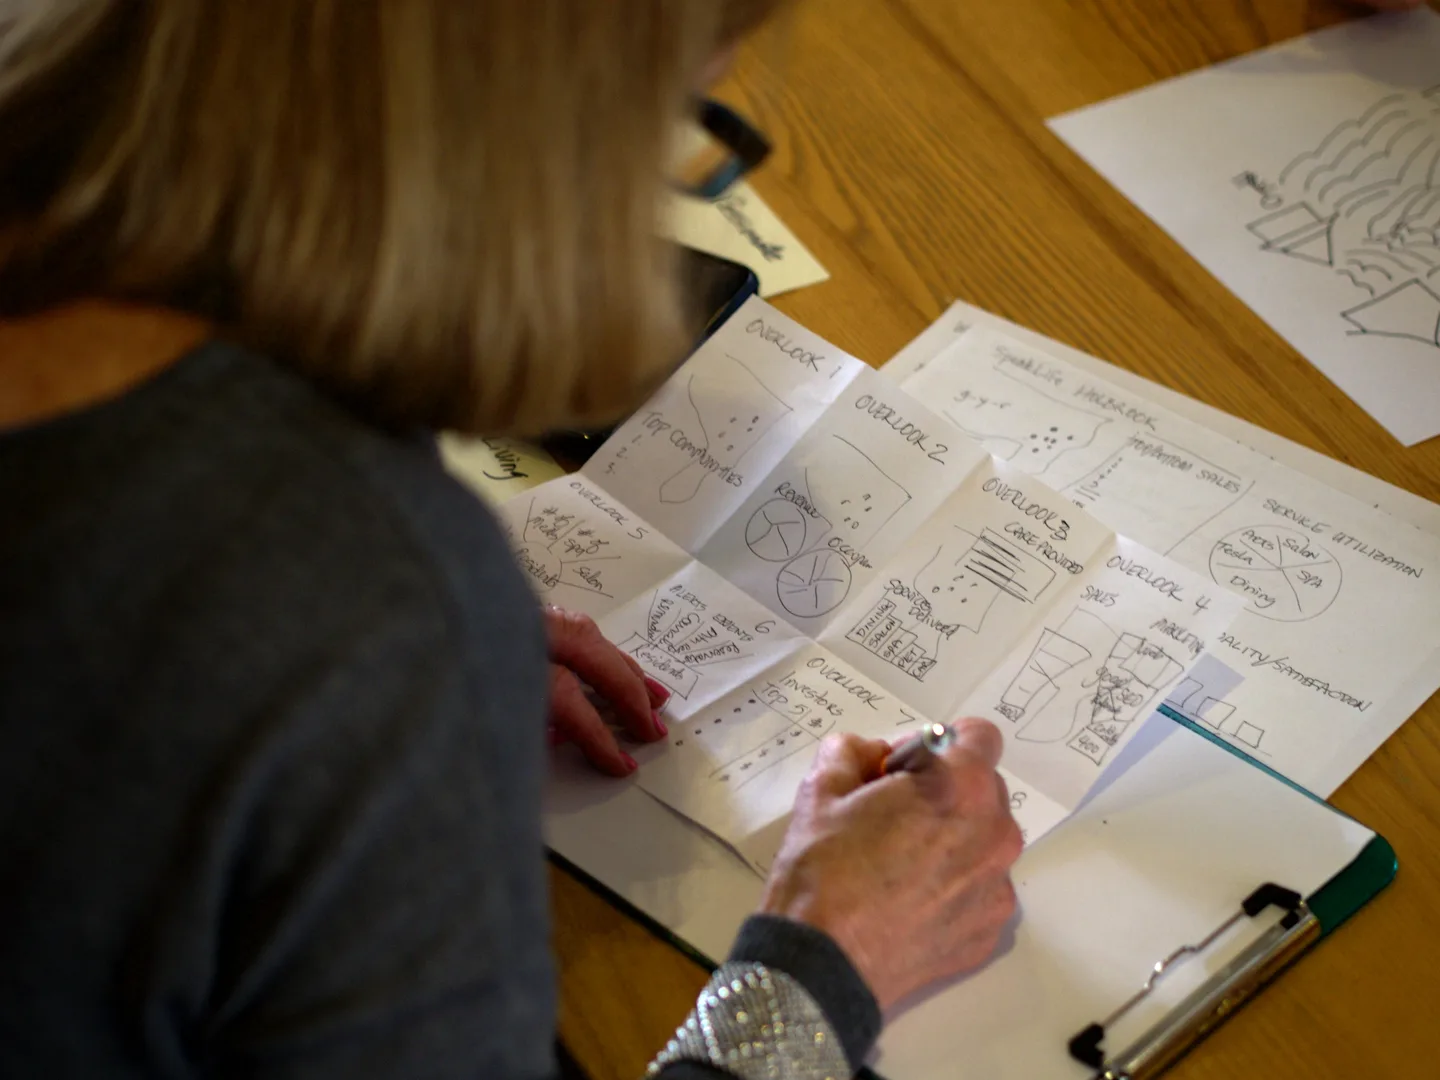
The sprint workshop included expert interviews, "How Might We" theme identification and voting, 2-year goal setting, sprint questions, concept sketching, solution voting, and storyboard creation. The team established clarity and direction, then focused the prototype on an executive dashboard with report-generation capability.
By the end of the sprint, leadership collectively identified five goals: connect disparate data points for analysis, gain visibility into business metrics and facility operations, compile operational statistics and generate reports, define metrics with targets and acceptable variance ranges, and enable sending and receiving alerts for out-of-alignment metrics.
User Testing & Validation
The clickable prototype was tested with 7 actual end users who were guided through the task of creating a report. Response was overwhelmingly positive, validating both the need and desire for an aggregated dashboard of easy-to-consume metrics. All testers said they would happily use the dashboard over their current method of gathering information.
Testing uncovered four major themes that reinforced the design direction: the dashboard was simple and clean, users wanted the ability to dig deeper into data, manipulation and customization was intuitive, and color-coding provided instant comprehension of metric status.
Four validated themes from prototype testing
Simple & Clean
Layout was easy to understand at a glance. One aggregated place for needed information. Visuals provided quick contextual understanding of metrics.
"It's very clean; it's very simple. It's not overwhelming.", Fallon
Ability to Dig Deeper
Important information surfaced at the top with easy drill-down into categories, metrics, or communities. Visuals and targets aided quick, deep understanding.
"...because that's where you can put key information about that property.", Ina
Easy to Manipulate
Customized dashboards for individual roles. Reports tailored to specific needs. Modern UX conventions made creating and manipulating data simple and intuitive.
"Sweatless Experience.", Stacy
Color as Data Layer
Color-coding communicated information in milliseconds compared to written text. Every user responded positively and wanted universal application of color conventions.
"Anytime you saw a... its blue... that would be helpful.", Ina
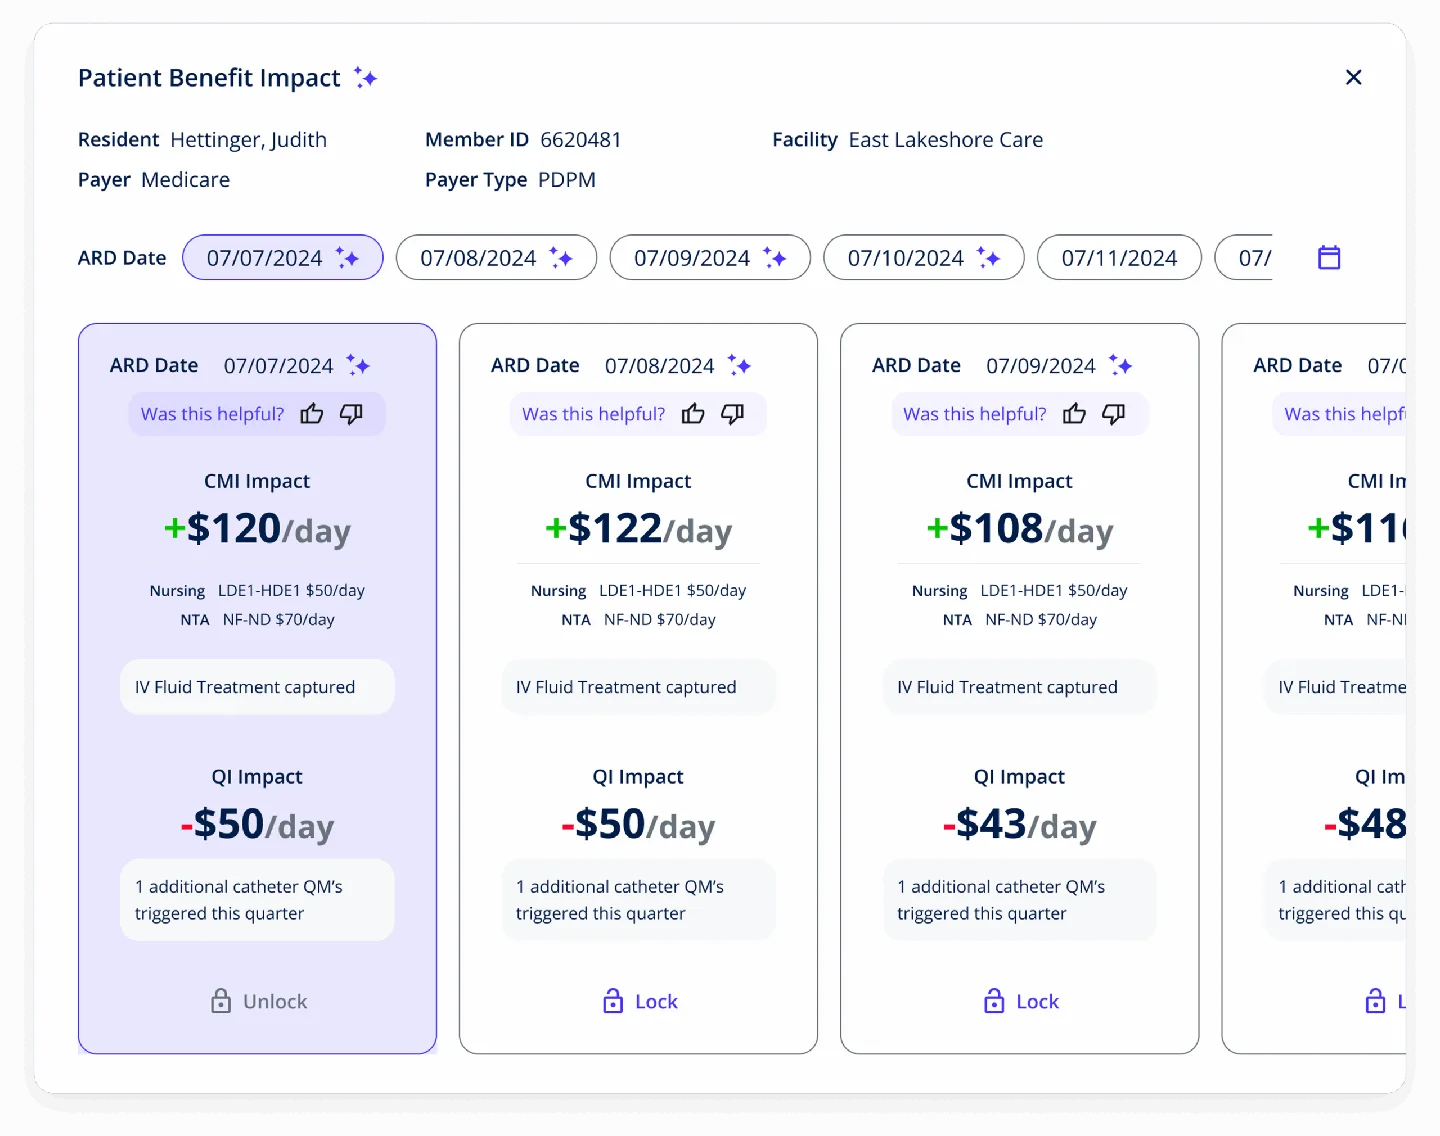
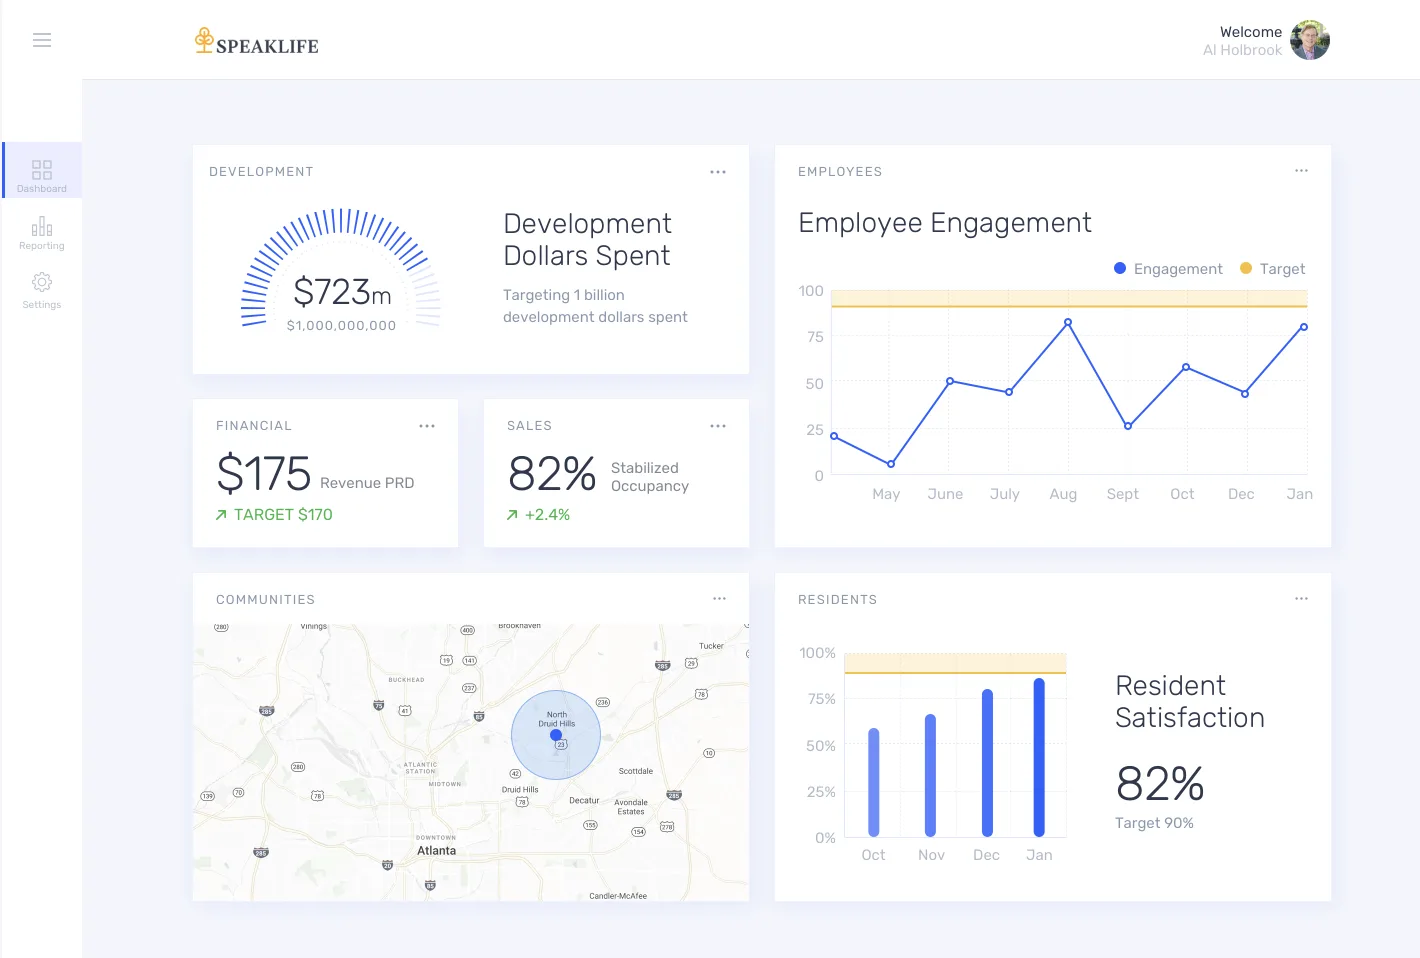
Dashboard prototype developed in days, not months
Once critical metrics were identified, the design team created a prototype providing quick visibility into business metrics and operational statistics. With built-in reporting, the tool gave leadership on-demand access to data for informed, actionable decisions.
Executive dashboard overview with key performance indicators
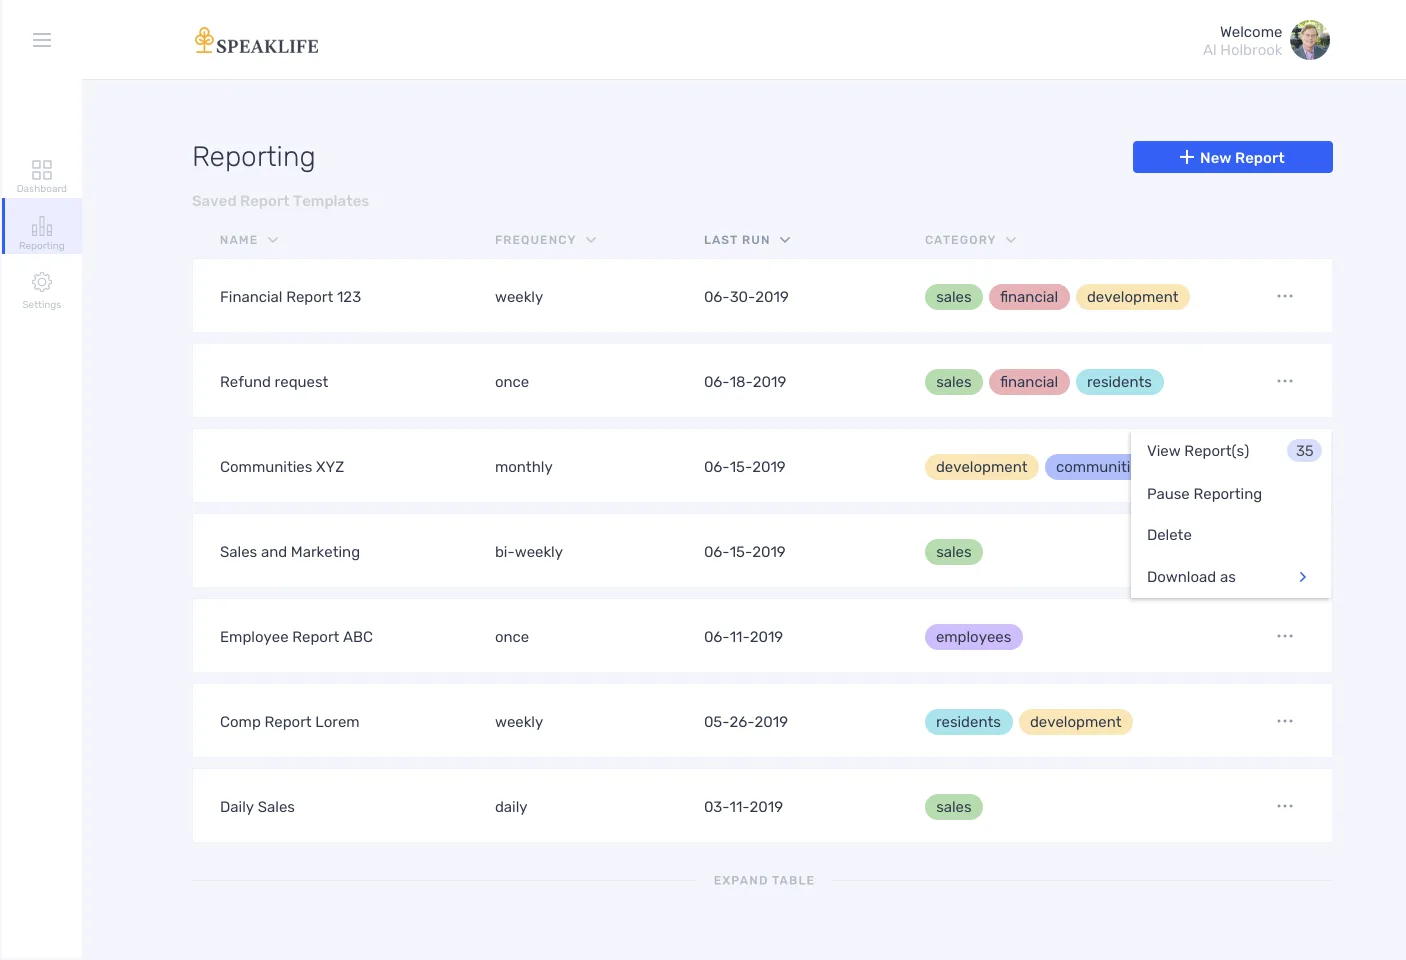
Reporting interface with categorized templates and scheduling
A clear roadmap from assessment to implementation
Digital Scientists delivered a comprehensive set of recommendations spanning customer experience, technology architecture, and organizational process. The engagement gave Holbrook a clear path forward with prioritized, actionable next steps.
Technical Recommendations
Implement Alice Concierge
Fill gaps with resident profiles, request systems, maintenance, staff app, and white-labeled resident app.
Re-evaluate iPad App Designs
Current designs had usability, accessibility, and brand alignment issues. Alice Concierge offers integrated alternative.
Improve CRM Usage
Set explicit expectations for sales employee data entry and define the CRM-to-Voyager data handoff point.
Replace ServingIntel
Move to a cloud-based POS to eliminate on-premise server requirements per campus.
Design Sprint Next Steps
Solidify Requirements & Scope
Finalize metrics, requirements, and scope for the dashboard MVP based on sprint findings.
Solution Architecture
Understand current systems and how metrics can be pulled into the dashboard implementation.
User Journeys & MVP Design
Map user journeys, design the MVP, and write high-level user stories for development.
Further Testing
Refine reporting flow, test user roles and custom views, expand metric visualizations.
Engagement Outcomes
Through the strategic assessment and design sprint, Holbrook's leadership team achieved alignment on critical metrics and received a dashboard prototype designed to provide meaningful, actionable insights, all compressed from months into days.
- C-suite aligned on shared data vision and critical objectives
- Executive dashboard prototype validated by 7 actual end users
- Comprehensive technology architecture assessment with prioritized roadmap
- End-to-end service blueprint with customer journey insights
- Concrete short-term and long-term technical recommendations
- 100% of testers preferred the new dashboard over existing data-gathering methods
"Adds a lot of value for our day to day. It's very clean; it's very simple. It's not overwhelming."
Holbrook Leadership Team
User Testing Feedback
Ready for your strategic assessment?
Let's talk about how Digital Scientists can help align your leadership, assess your technology landscape, and deliver validated prototypes.