Stop losing demos.
ToolsGroup's ML-powered SO99+ was first in class for predictions—but competitors were winning deals on UX alone. We redesigned the entire experience in 5 months.
A global supply chain leader needed a UX to match its engine
ToolsGroup's SO99+ supports supply chain planners across industries worldwide, helping them intelligently stay on top of their ever-changing supply chain. Their ML-powered prediction engine is battle-tested and first in class—with 15–20% market share. But competitors had begun winning deals on user experience alone, sometimes even to the neglect of prediction accuracy.
Three-quarters of ToolsGroup's sales losses were UI-related. The company was losing demos it should have been winning. Digital Scientists worked directly with the C-Suite—including CEO Inna Kuznetsova—to define the future product direction and incorporate client and sales team needs into a modernized experience.
This engagement is our strongest example of helping PE-backed portfolio companies stop losing demos and start winning them—through C-Suite alignment, deep user research, and a vision that the entire organization can rally behind.
Client
ToolsGroup (PE-backed)
Industry
Supply Chain Planning, Retail, Logistics
Engagement
Drive Growth (PE Digital Transformation)
Services
Alignment workshop, UX research, Competitive analysis, Heuristic evaluation, UX/UI design, Functional prototype, User validation, Design system, Technical assessment
Platform
Web (Enterprise SaaS)
Timeline
5 months (Kickoff to Final Deliverables)
Method
Capabilities
Stakeholder Interviews
Hours of Research
Kickoff to Delivery
Sales Losses Were UI-Related
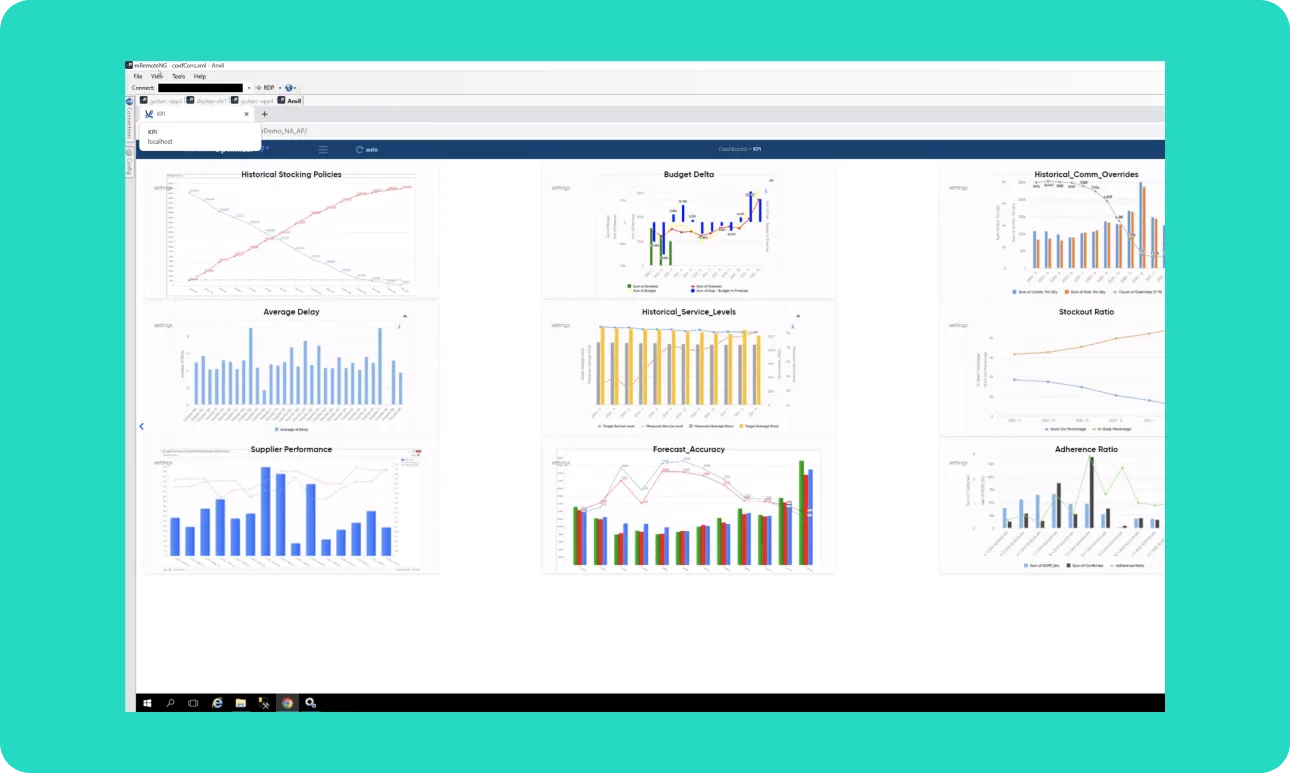
A best-in-class engine trapped behind a dated experience
Over the years, the user experience of SO99+ had waned in comparison to its ML engine performance. The platform's overall market stance was threatened as competitors competed on experience—and won. The existing interface had several critical problems that drove low adoption, long sales cycles, and customer churn.
Dated Interface
Broken design patterns, dated visualizations, and lack of coherence between screens made the platform feel antiquated.
Confusing Navigation
Too many items, unclear hierarchy, and navigation mixed with quick links left users lost and reliant on memorization.
No Actionable Insights
Dashboard was a collection of quick links, not providing valuable insights. Alerts overwhelmed users—40,000+ with no clear prioritization.
User Hesitation
Limited undo capabilities, no error prevention, and no flexibility to personalize left users working cautiously and slowly.
What ToolsGroup needed
UI/UX as a competitive differentiator to win back sales
An intuitive, self-teaching interface that reduces training time
Increased perception of value across multiple personas
A user-validated demo prototype to sell the vision
A development-ready design system for offshore teams
Actionable dashboards with data relevant to each user's role
SO99+ before the redesign
Cluttered data tables, confusing filters, poor accessibility, and no design system.

"I am ecstatic about how actionable the insights are—every portfolio company should do this!"
Inna Kuznetsova
CEO, ToolsGroup
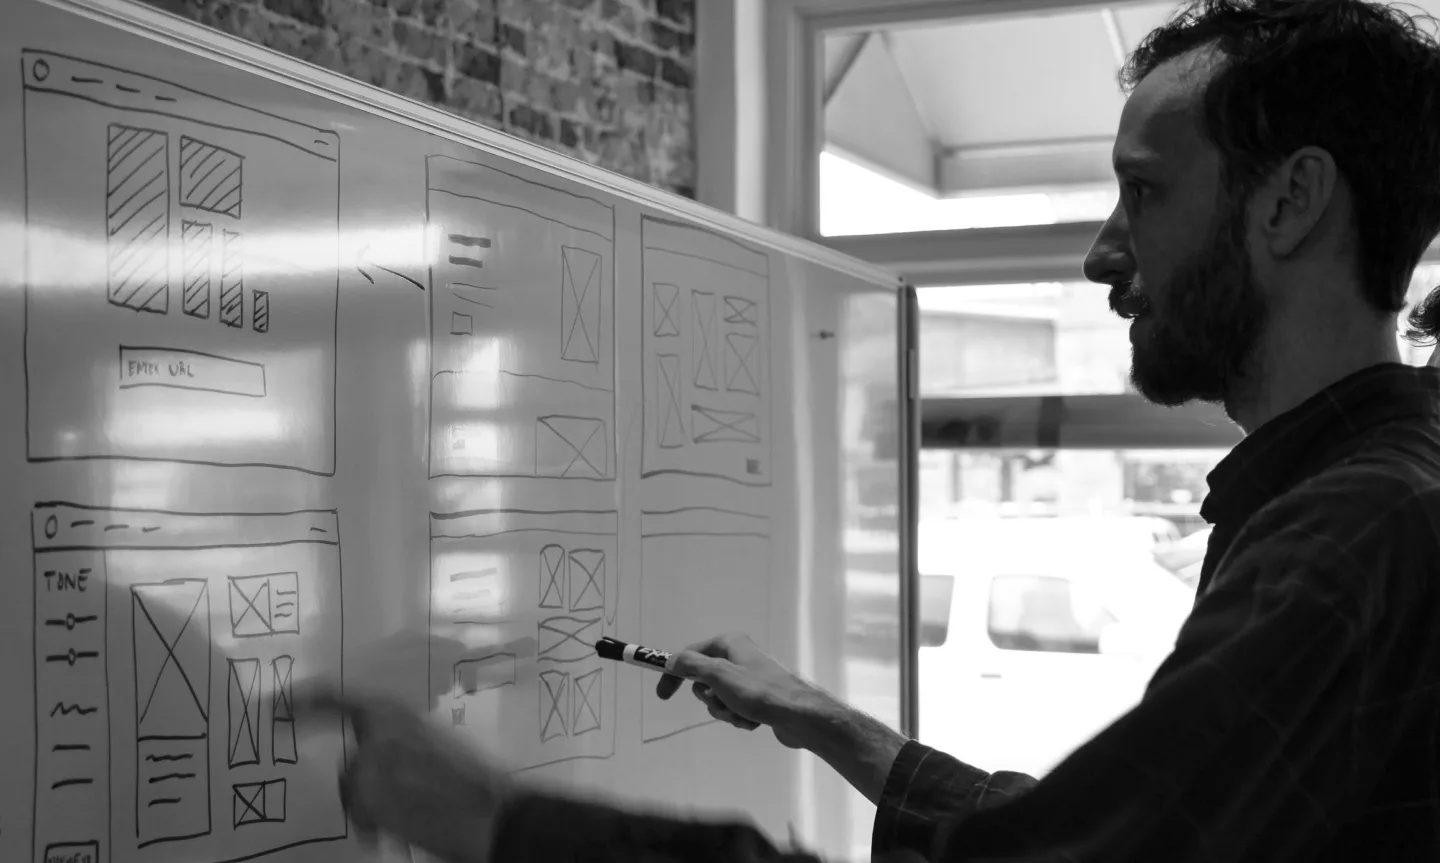
From stakeholder alignment to validated prototype in 5 months
Working directly with the C-Suite and key stakeholders, Digital Scientists assessed existing design patterns, conducted deep user research, created a modernized UI design system, and delivered a high-fidelity prototype validated by real users. We also performed a technology review to supply tradeoffs between front-end implementation systems—giving leadership the complete picture to make informed product decisions.
Alignment Workshop
Product vision canvas, competitive landscape mapping, user persona definition, and MSCW prioritization with key executive stakeholders.
UX Research & Interviews
31 one-on-one interviews (16 internal, 15 external) with presales, professional services, partners, and demand/supply/purchasing stakeholders. 40+ hours synthesized via affinity mapping.
UX/UI Assessment
UX teardown, 10-principle heuristic evaluation, WCAG 2.1 accessibility audit, and competitive landscape analysis against BlueYonder, O9, Kinaxis, and others.
Design & Prototyping
Information architecture redesign, workflow mapping, wireframing, visual design, and a high-fidelity clickable prototype for 4 key screens: Dashboard, Forecast, Demand Tunnel, and Proposal Editing.
User Validation
7 validation interviews (3 internal, 4 external) gathering first impressions, identifying issues, and describing future user expectations. Feedback incorporated into final design system.
What 31 interviews and a heuristic evaluation revealed
After reviewing 40+ hours of interviews, we synthesized findings through affinity mapping. Combined with our UX teardown and heuristic evaluation, we identified six critical themes.
Leaving the Tool
Clients constantly had to leave SO99+ because they didn't trust results or lacked functions to complete tasks—switching to Excel, email, and other tools to get work done.
24 mentions
Feature Overload
Users felt confused by an overflow of functionalities not common to their daily tasks. Too many filters, too many alerts, and no guidance on what mattered.
23 mentions
Disorientation
Users got lost performing tasks—needing to memorize step-by-step actions and workflows. The software offered no guidance or contextual help.
14 mentions
Performance Issues
Slow and laggy software limited task optimization and was a common pitfall in the sales process—running reports, switching modules, and importing data.
11 mentions
User Hesitation
Limited functions to prevent mistakes or undo changes meant users worked cautiously—especially when approving data, editing proposals, and updating reports.
11 mentions
No Personalization
The platform lacked flexibility to personalize the experience. Users couldn't save views, customize shortcuts, or streamline repetitive processes.
17 mentions
Heuristic Evaluation Scores
Our senior designers assessed the SO99+ interface against 10 standard heuristic principles. Four areas scored critically low:
Help & Documentation
Flexibility & Efficiency
Consistency & Navigation
System Status Feedback
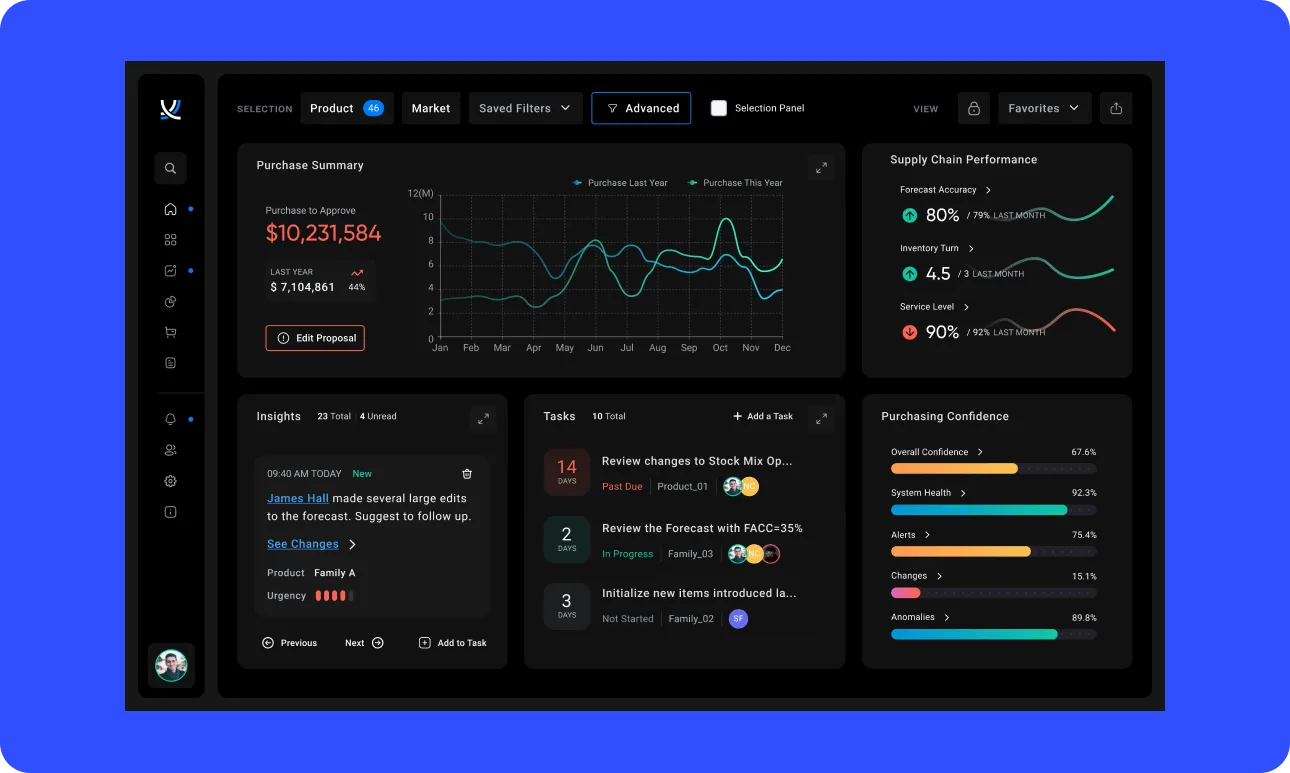
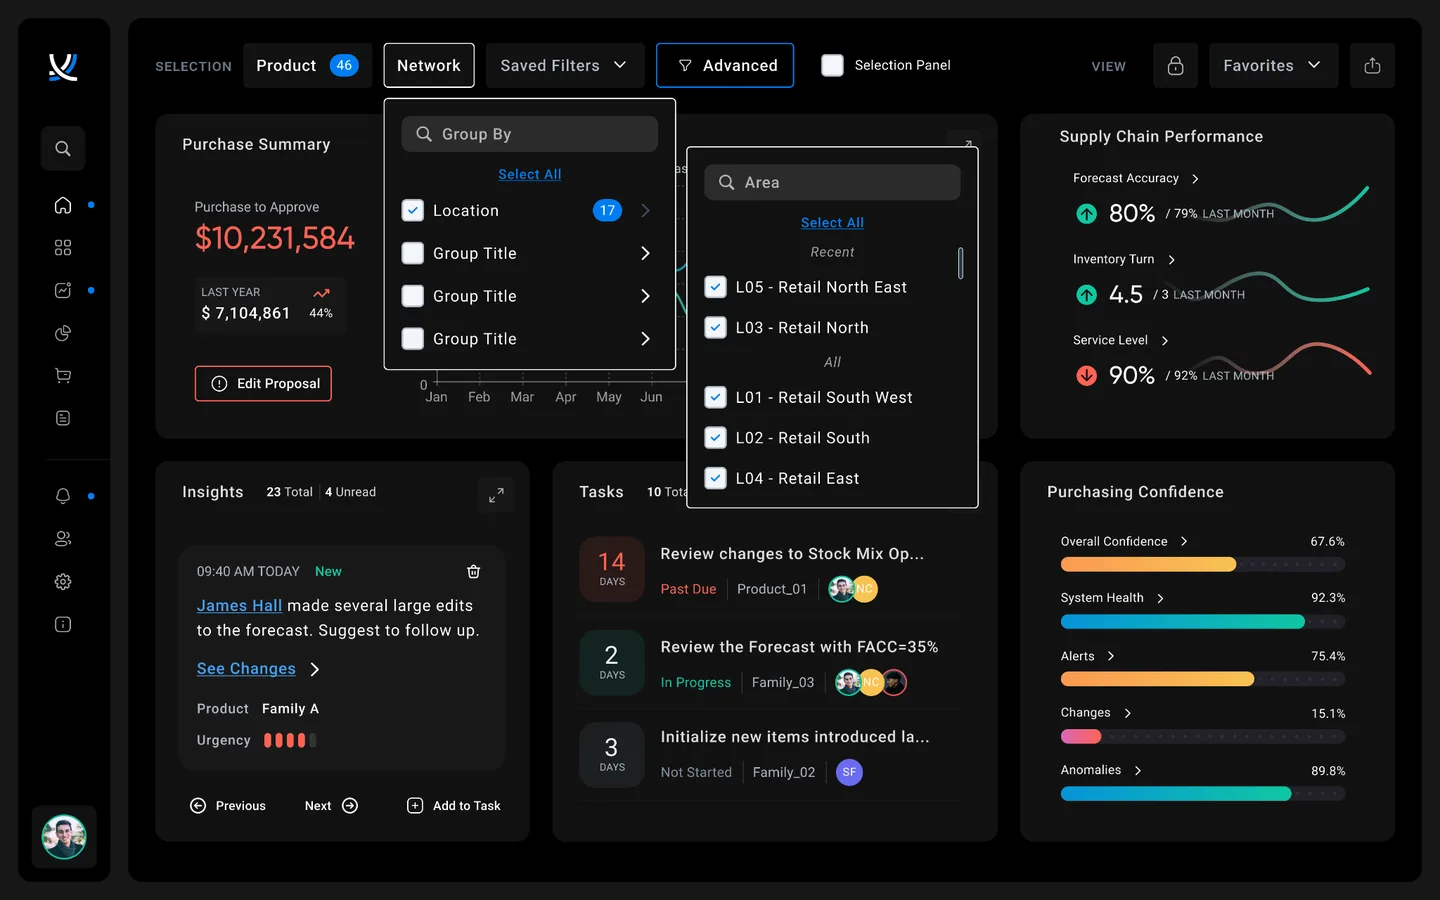
A modernized experience that makes the user successful
We redesigned four key screens—Dashboard, Forecast, Demand Tunnel, and Proposal Editing—addressing every pain point uncovered in research and validated with real users.
Smart Filters
Re-organized and relocated filters to better fit user needs and daily workflows.
Actionable Dashboard
Organized data visualizations providing actionable insights, KPIs, and task management in one view.
Customizable Display
Fully customizable data display with saved views, personalized shortcuts, and user preferences.
Intuitive Navigation
Simple and intuitive navigation with clear hierarchy for easier wayfinding across the platform.
Self-Explaining Workflows
Re-imagined user experience with contextual help, progress indicators, and guided task completion.
Modern Design System
Up-to-date user interface with a defined design system for future development flexibility and consistency.
SO99+ after the redesign
A sampling of screens from the redesigned application — from high-level dashboards to detailed proposal workflows.
Purchase Summary
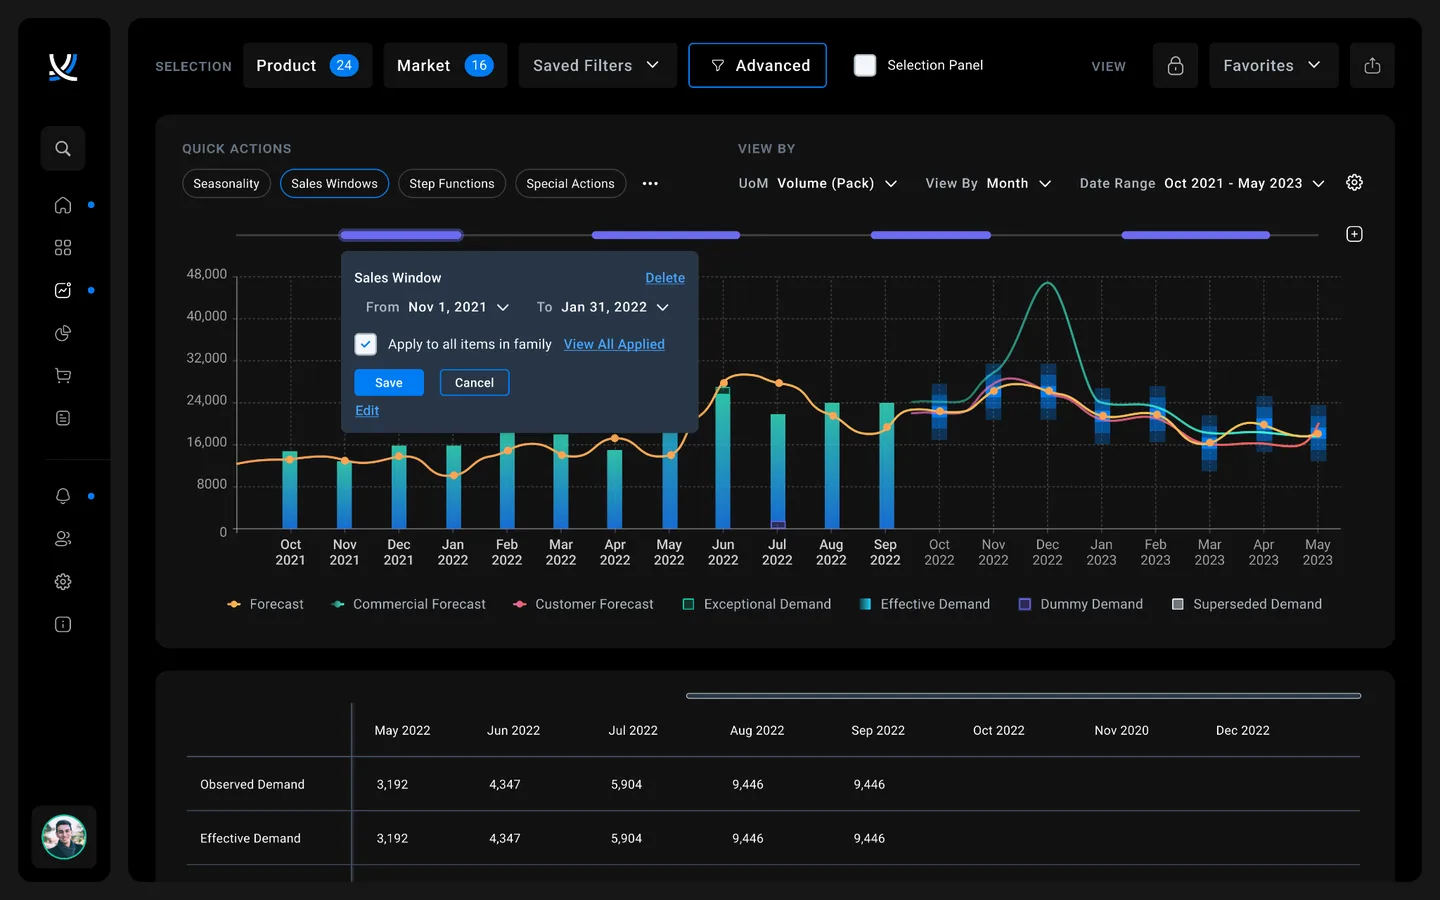
Demand & Forecast
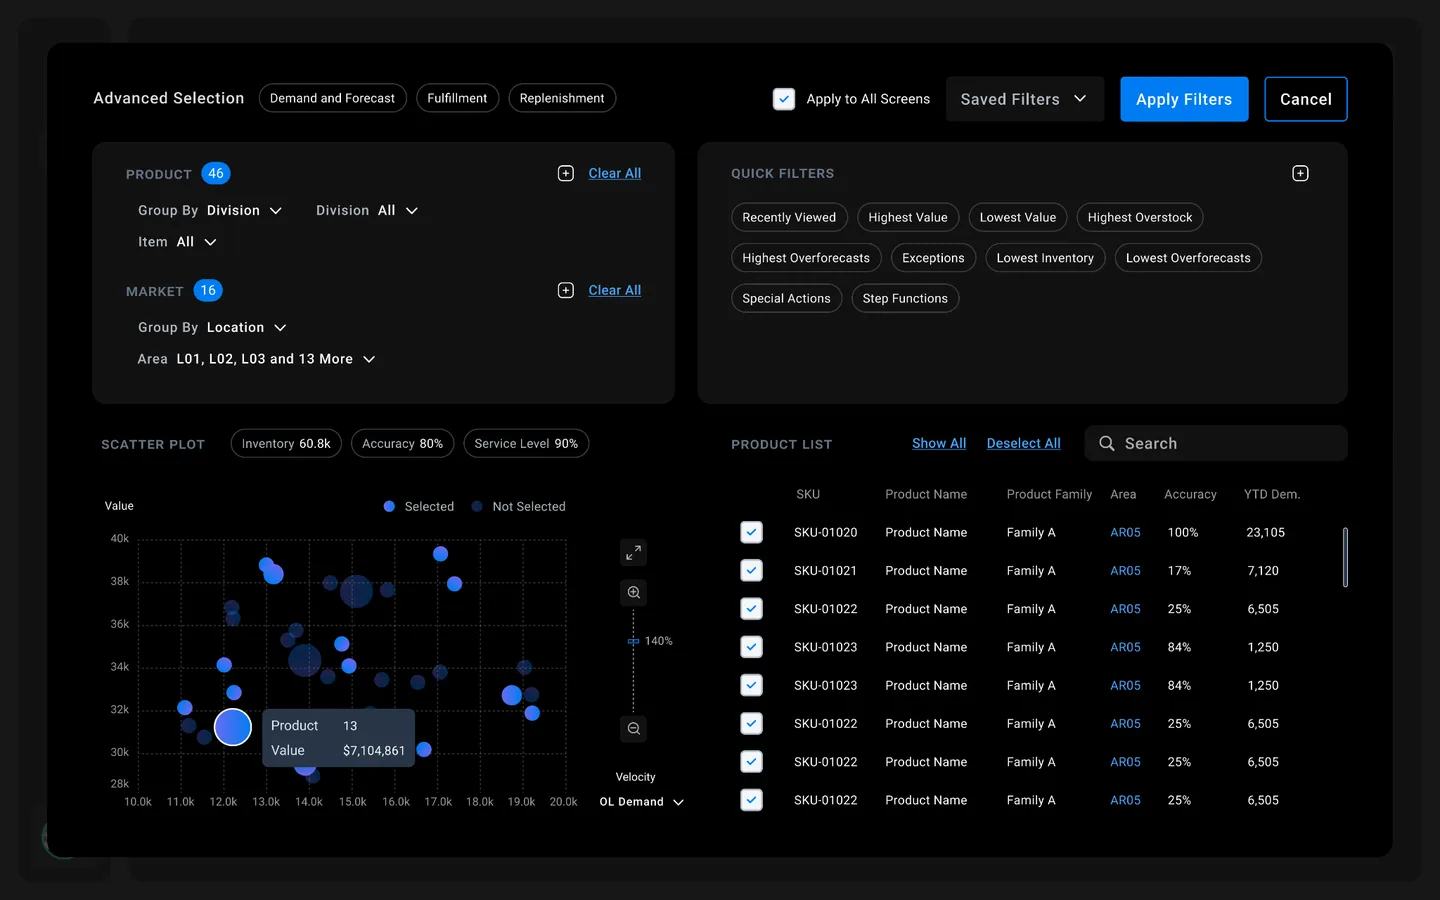
Product Selection
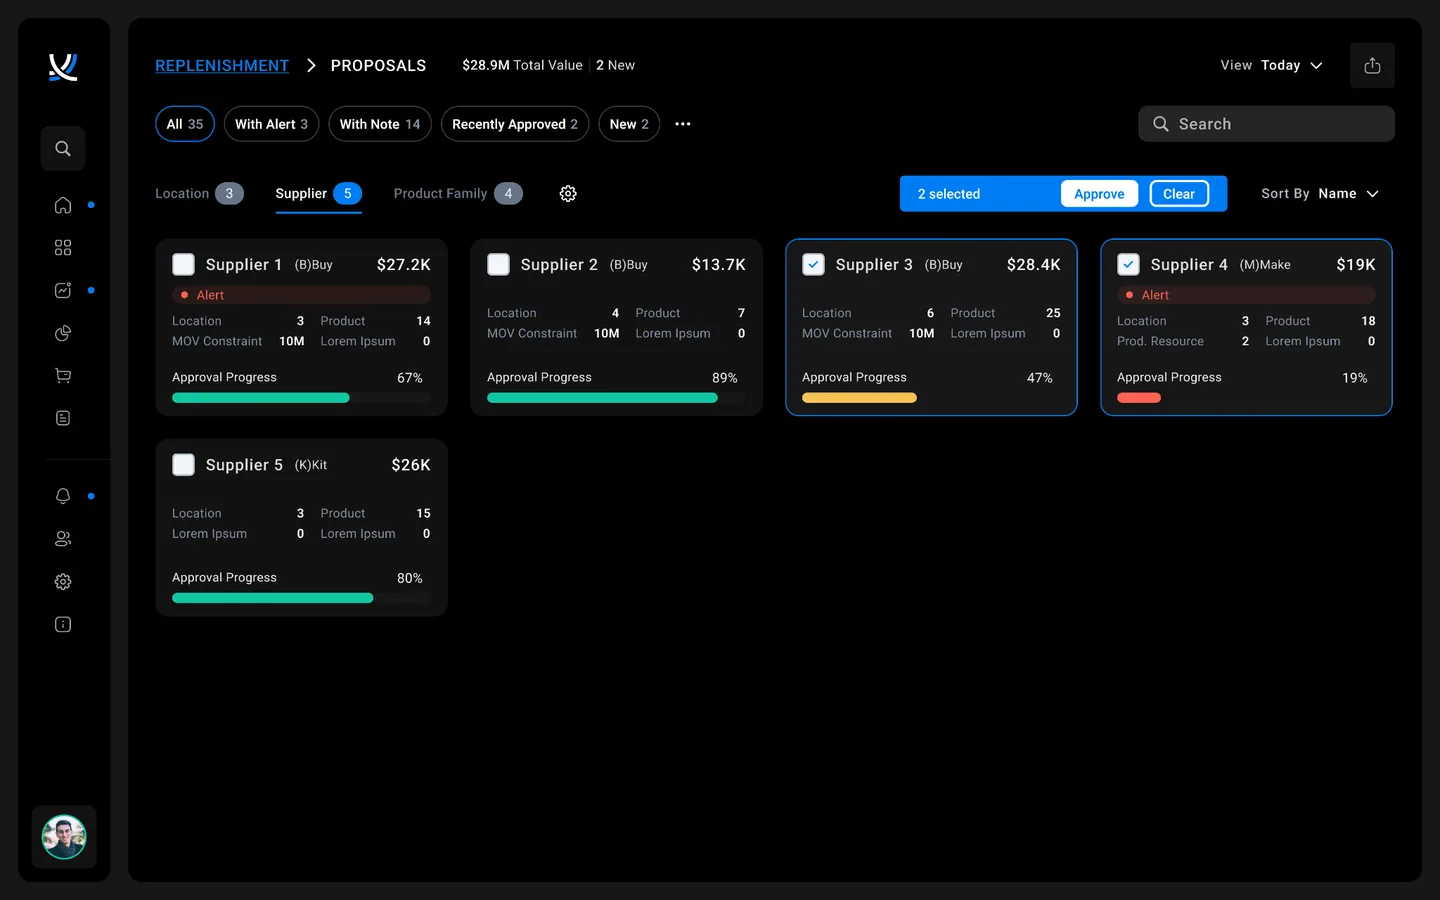
Proposals
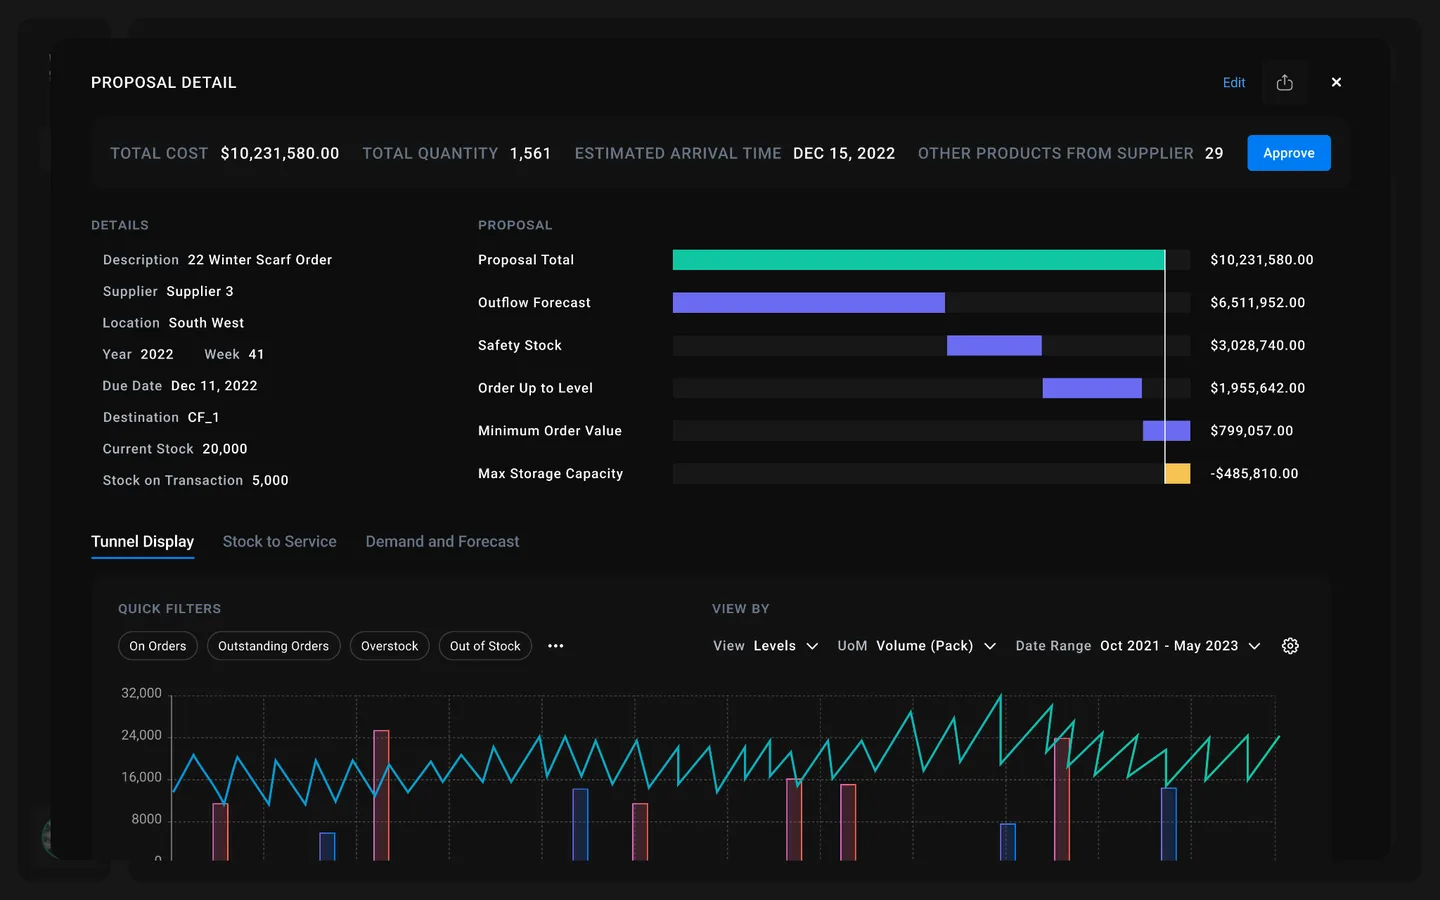
Proposal Detail
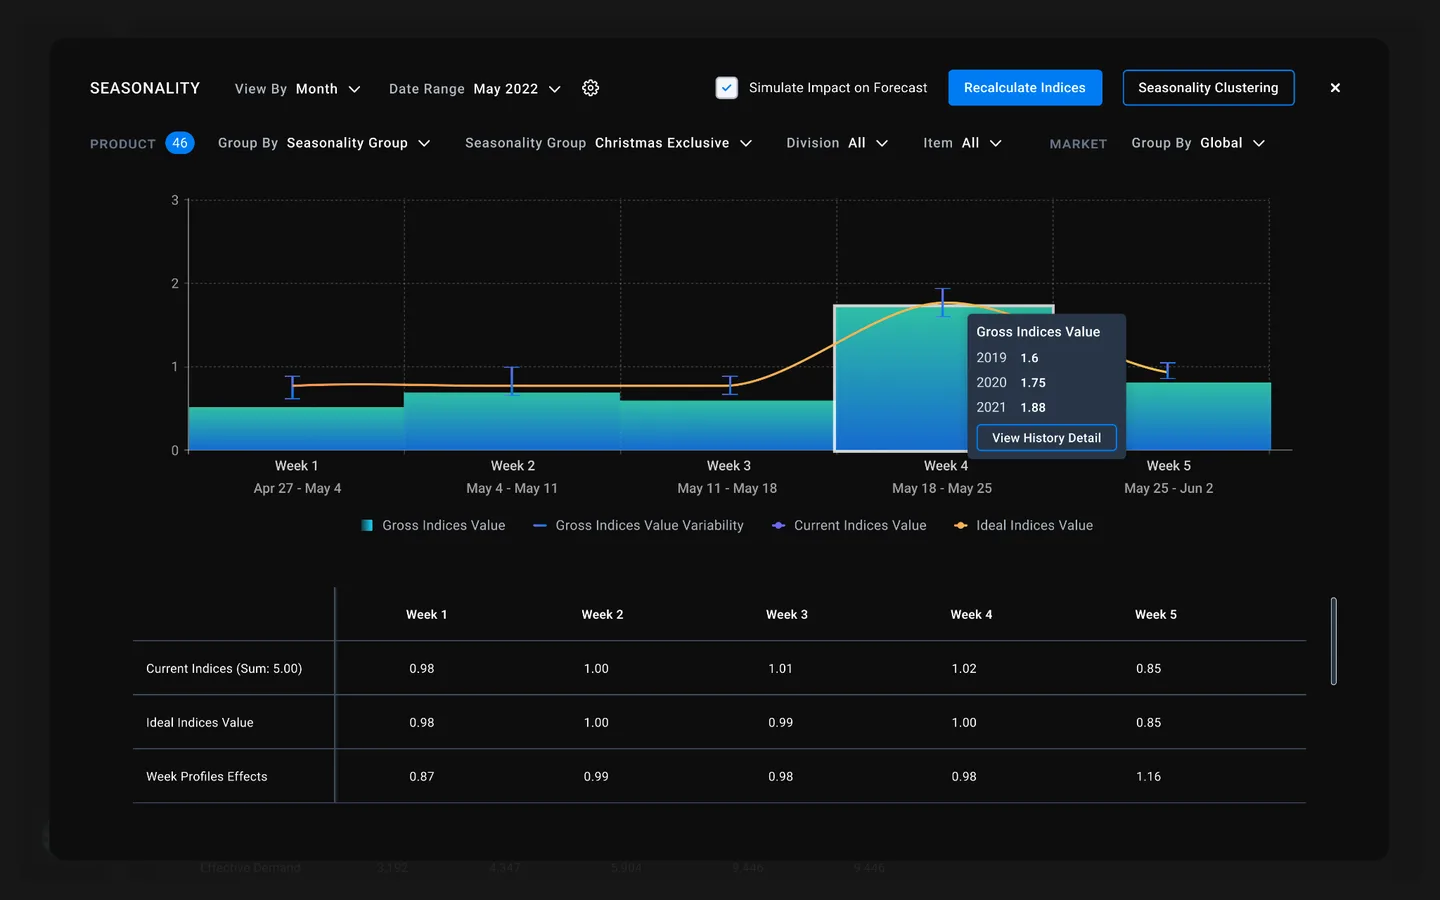
Seasonality
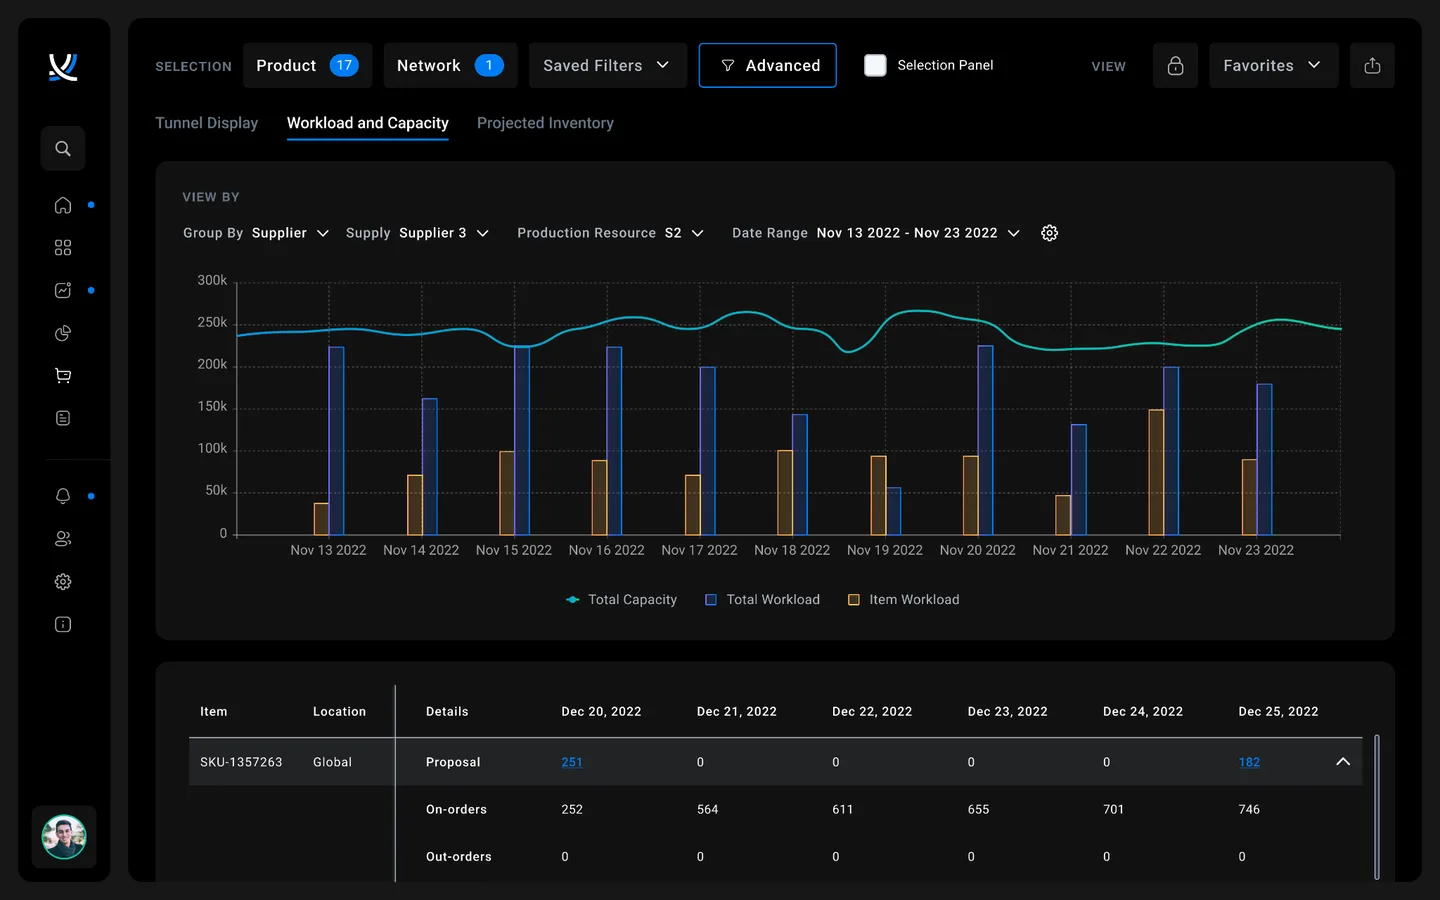
Workload & Capacity
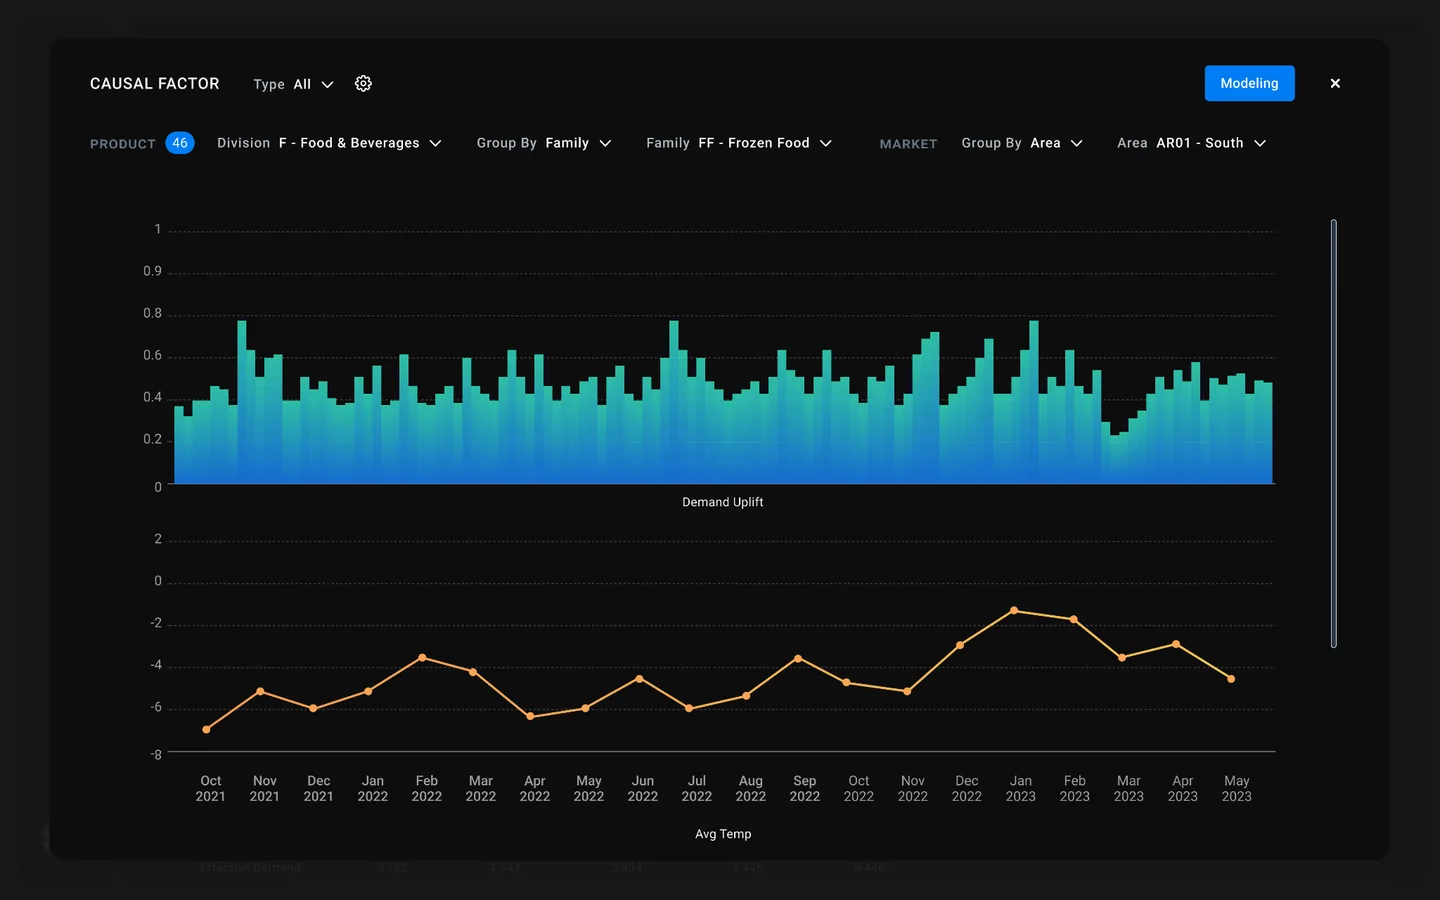
Causal Factor
What we delivered
In 5 months, our team produced a comprehensive set of deliverables that gave ToolsGroup everything they needed to sell, align, and build.
Alignment Workshop Output
Product vision canvas, competitive landscape, user personas, and MSCW scope prioritization.
User Research Report
Comprehensive insights from 31 interviews synthesized into actionable themes and opportunity areas.
Product Audit & Heuristic Analysis
UX teardown, 10-principle heuristic evaluation, accessibility audit, and competitive landscape analysis.
High-Fidelity Prototype
Clickable prototype of 4 key screens with finalized workflows, wireframes, and visual design in Figma.
Design System
Complete design system with component library, style guide, and patterns ready for development handoff.
CEO Vision Video
A polished video walkthrough that gave the CEO a powerful commercial for communicating the product's future direction to employees, clients, and partners at the global town hall and sales conferences.
User Validation Insights
Screen-by-screen feedback from 7 validation interviews with strengths, pains, and opportunities documented.
Product Roadmap
Prioritized requirements and implementation roadmap translating design vision into development phases.
Technical Assessment
Front-end technology review with tradeoffs between implementation systems to support the recommended design.
From losing demos to leading with confidence
In 5 months, Digital Scientists designed a modernized, user-validated and sales-validated experience that transformed how ToolsGroup competed in the market. The project was completed on time and on budget.
Most importantly, we gave the CEO a powerful tool for communicating where the company was going—a polished vision video that debuted at ToolsGroup's global town hall and multi-national sales partner conference, generating immediate excitement and alignment across every team worldwide.
Start winning demos
Sales teams gained a compelling prototype and vision video to show prospects the future of SO99+—turning a UX liability into a competitive advantage.
A CEO commercial
The vision video became a communication tool for the CEO to articulate product direction to employees, clients, and partners—generating global excitement at the town hall.
C-Suite product direction
Working shoulder-to-shoulder with the CEO and leadership team, we defined the future product direction and incorporated real client and sales team needs into the roadmap.
Development-ready design system
A cohesive set of design patterns handed off directly to offshore development teams for implementation—with a product roadmap to guide phased rollout.
The PE Playbook
This engagement demonstrates the model for PE-backed portfolio companies that need to modernize and start winning:
Align with the C-Suite
Define product vision with leadership, not just design teams
Validate with real users
Research and test with actual customers, not assumptions
Deliver a sales weapon
Give sales teams something compelling to demo immediately
Create company-wide alignment
A shared vision that energizes employees, clients, and partners
"We just completed the town hall, and I am sure you could hear the screams of excitement from around the globe."
Inna Kuznetsova
CEO, ToolsGroup
Ready. Set. Innovate.
Let's talk about how Digital Scientists can help transform your product experience.